TAM, SAM, and SOM together provide a comprehensive view of potential market size. TAM shows the maximum opportunity and helps you sell the vision. SAM filters it according to your business model. SOM homes in on what your operational capacity can achieve.
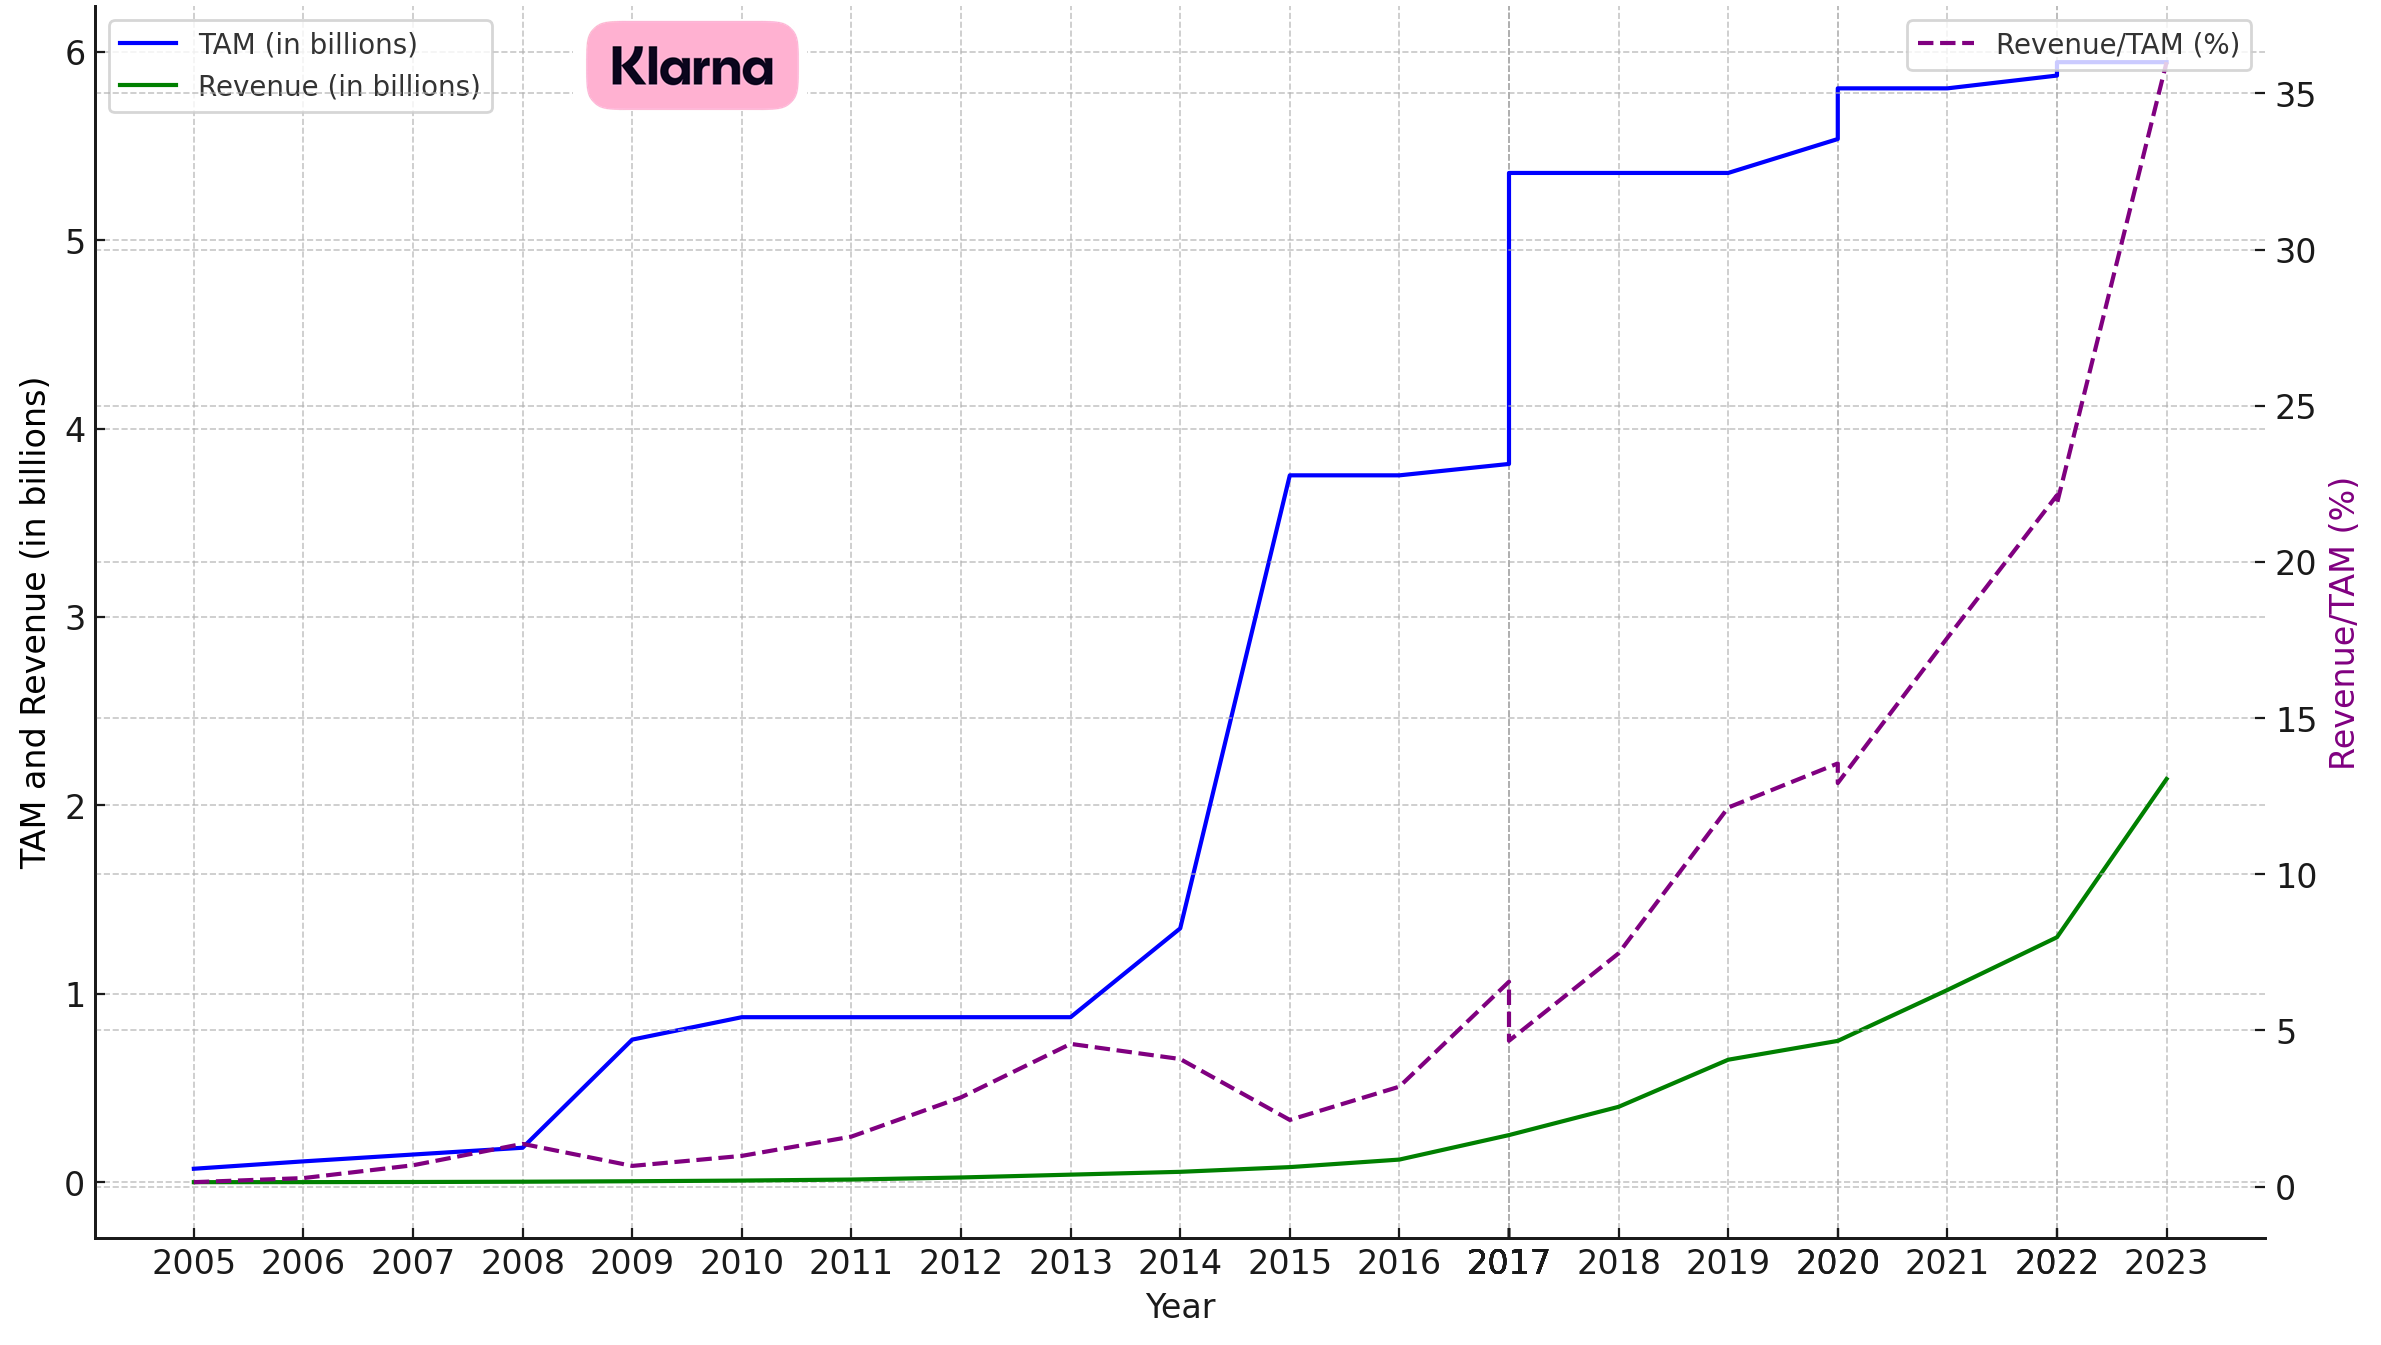
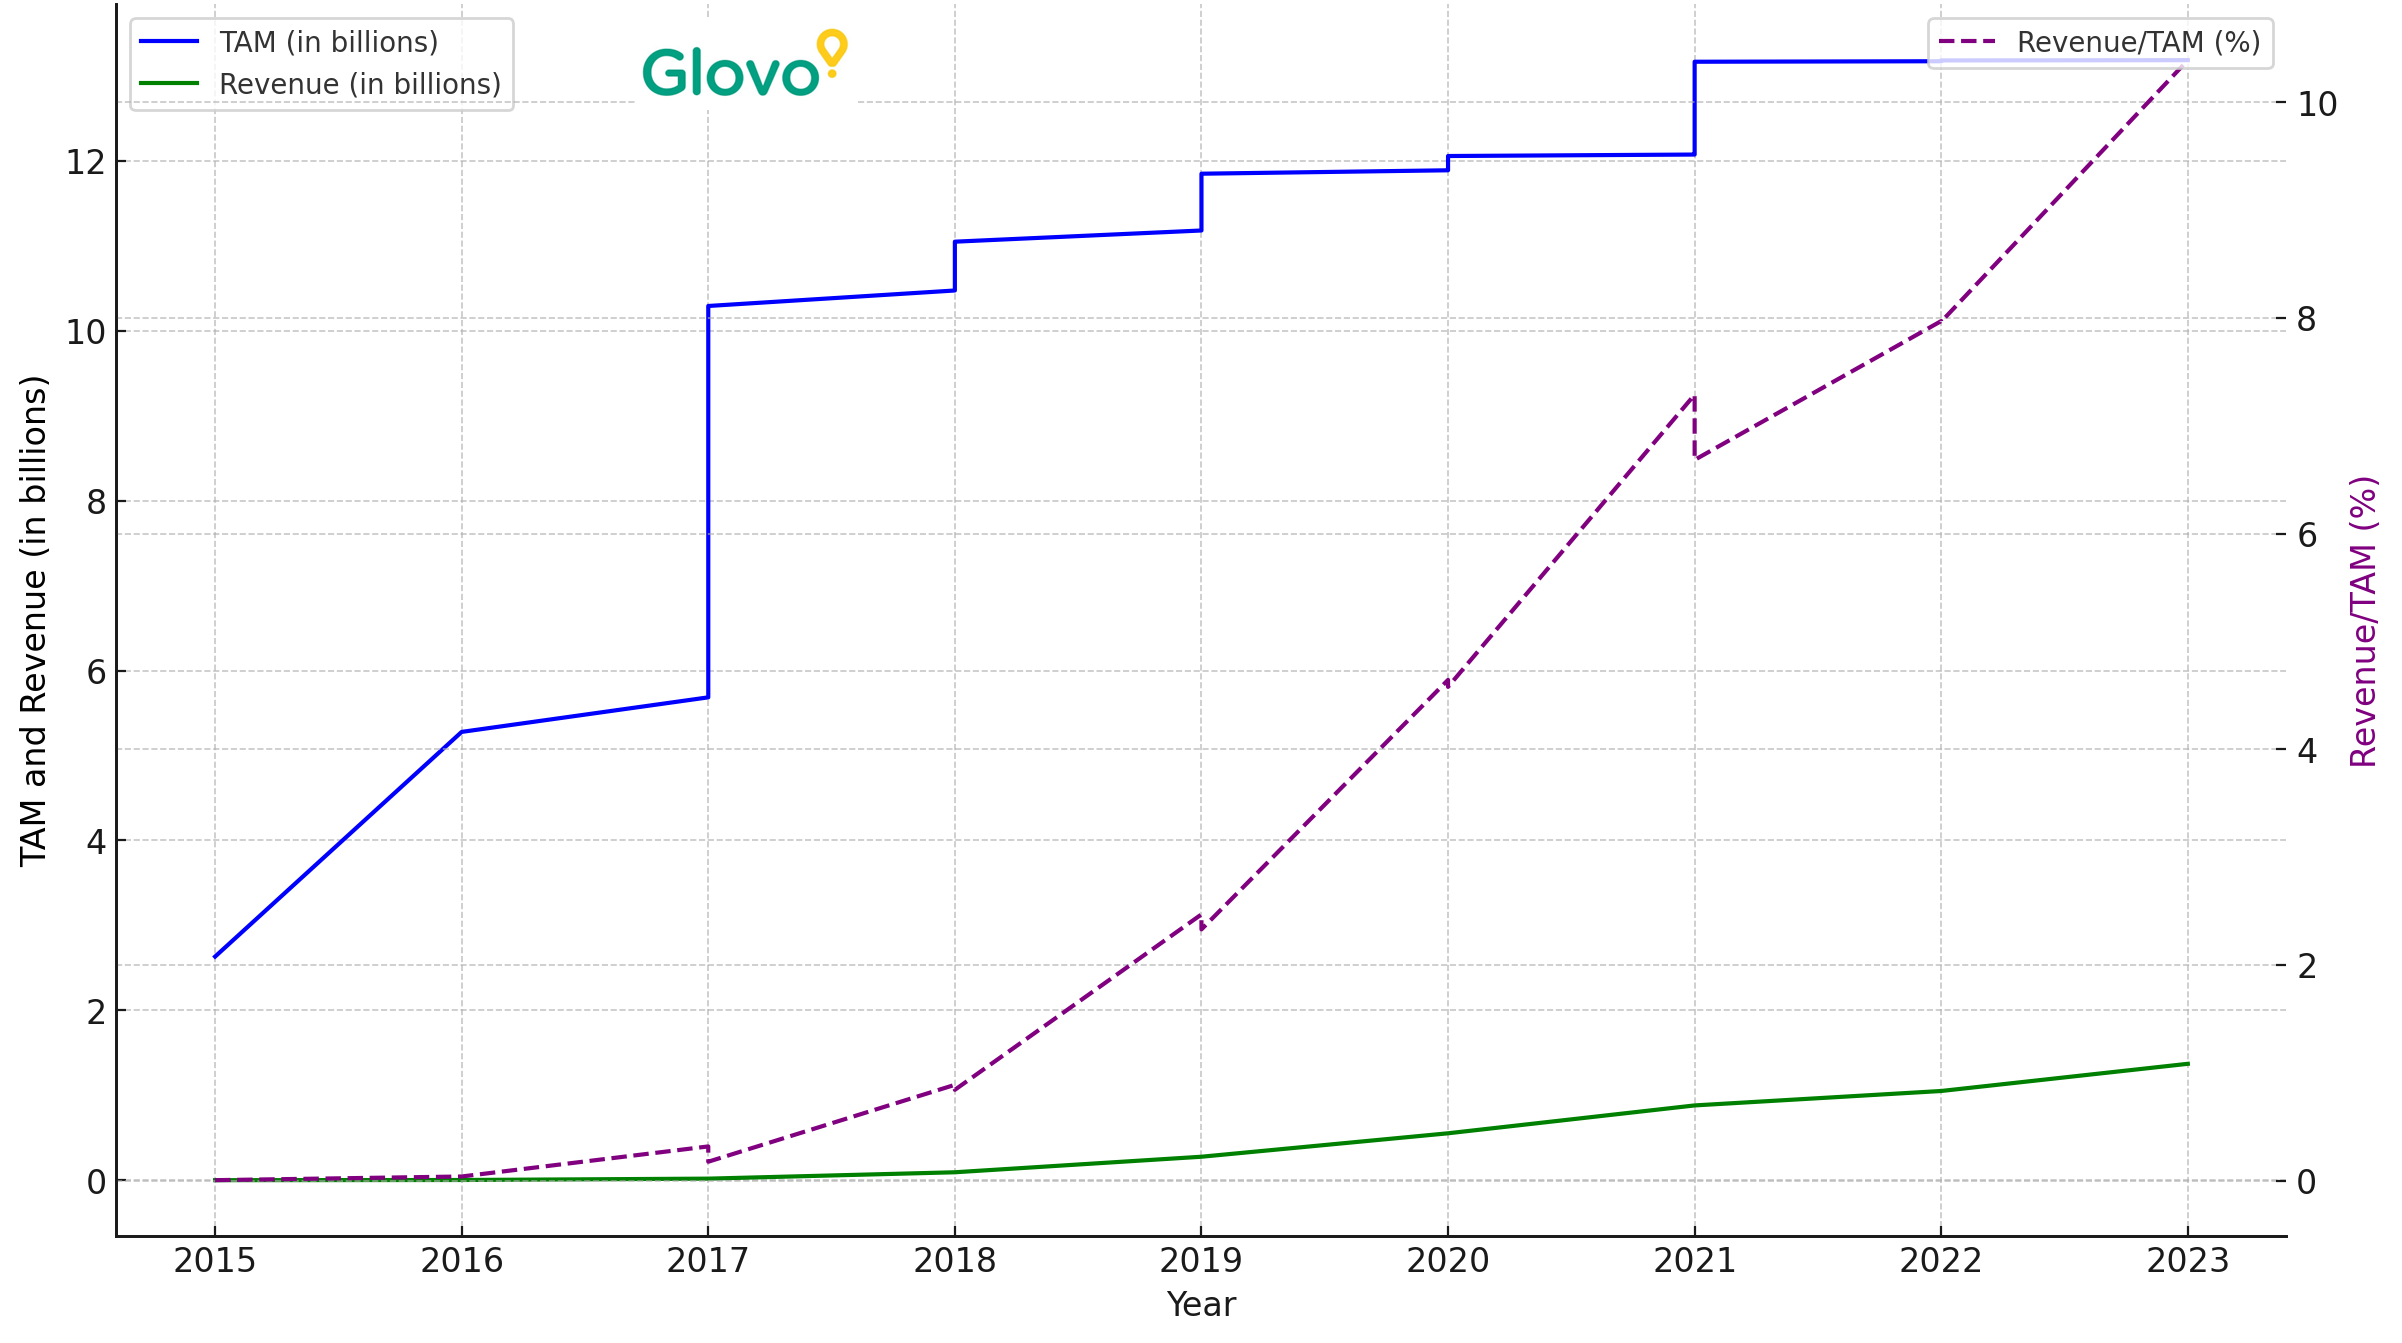
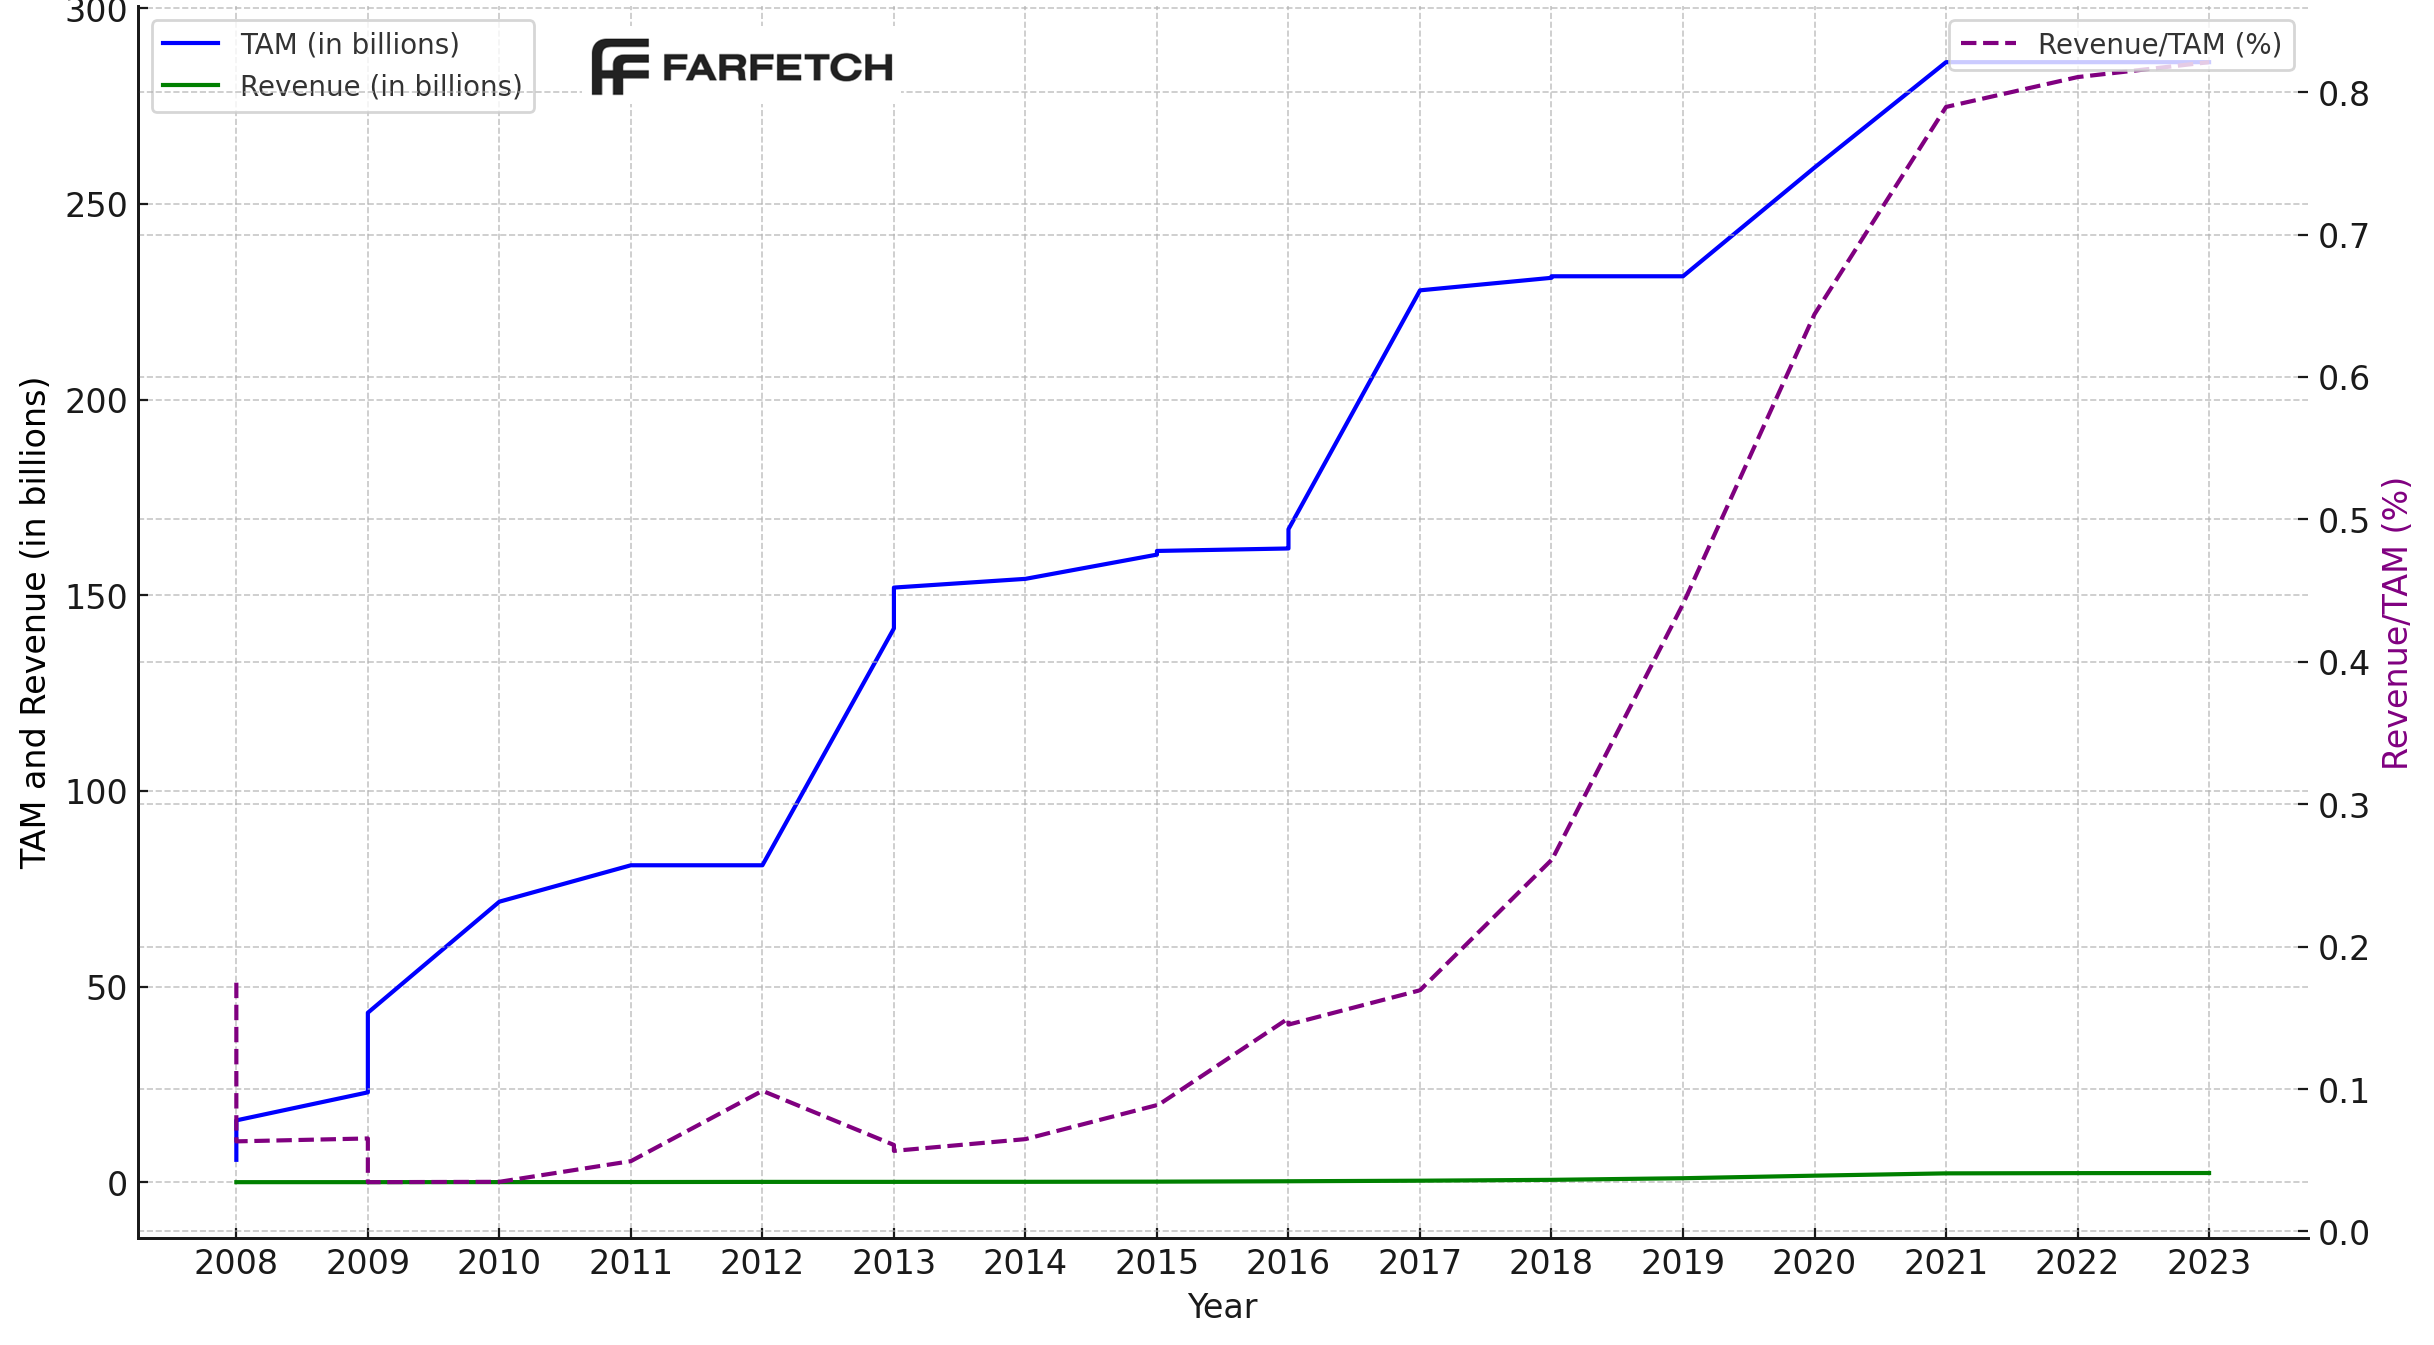
Then there’s reality: your revenue or your share of the market. Take a look at Glovo, Klarna, and FarFetch and their Revenue vs TAM charts.
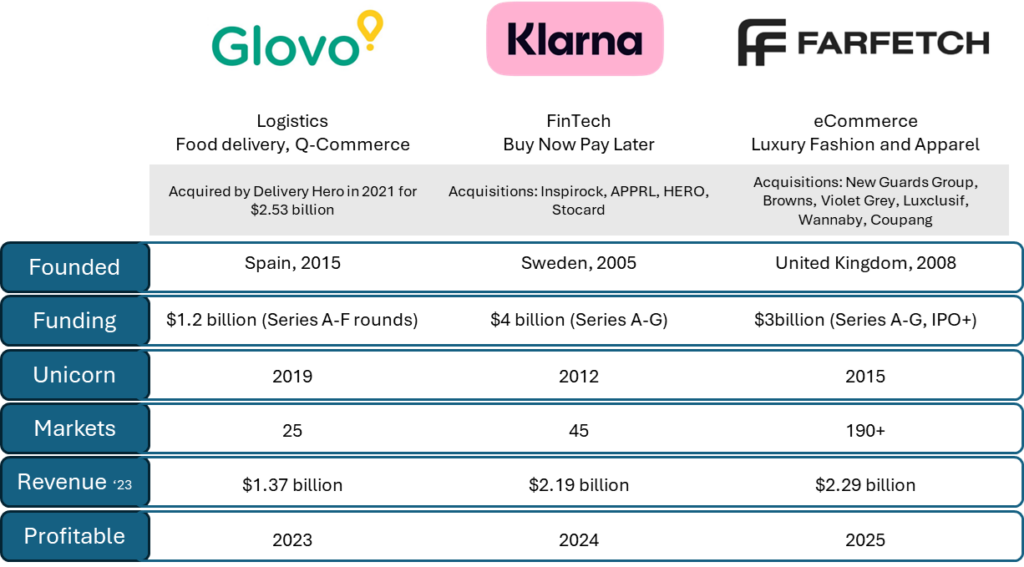
Your product-service-market strategy dictates your TAM, which varies dynamically by region over time, with each startup having a unique approach and trajectory. In my view, Revenue/TAM or market share efficiency is more interesting. Market Share Efficiency (MSE) kicks in when you have the edge over competitors and can scale and capture share in multiple markets.
MSE is key to driving profitability and ROI. Glovo, Klarna and FarFetch have achieved a compounding transformation of their MSE at some point, irrespective of their proposition or TAM/SAM/SOM size.
What’s the challenge?
It can take years to get to that sweet spot where you gain Revenue faster than TAM grows. If you don’t, your competitors will. Modelling TAM/SAM/SOM too far into the future is hard, but avoiding the temptation to inflate SOM forecasts too soon, is harder.
What’s the guideline?
Do your TAM/SAM/SOM homework but present it in a way that talks to vision and reality. Don’t overpromise on a SOM you will never attain, but be ready for the persistent determination needed to reach MSE. The smart investors you want to associate with will respect a lower SOM that’s real, and understand your MSE journey.
Additional takeaways:
· TAM roadmap by market, by time, not a single static number
· SOM needs to relate to your MSE execution and journey
· Less than 2% of TAM can still get you Unicorn status
· Remove barriers to gaining market share relentlessly
Happy pitching!
References:
- The VC Factory: https://thevcfactory.com/tam-sam-som/
- TechCrunch: https://techcrunch.com/2022/03/09/how-to-calculate-your-startups-tam-sam-and-som/
- Antrler: https://www.antler.co/blog/tam-sam-som