If you want to win, scale, and reach market share efficiency, you need more than a great product idea. You need four connected systems that reinforce each other:
- Customer System (find, serve, keep, and grow customers)
- Operations System (deliver reliably at increasing scale)
- Profitability System (sustain margins, cash flow, and smart allocation)
- Innovation System (adapts faster than customer tastes and technology change)
The companies that pull ahead don’t “work harder.” They align these systems so that every team decision compounds rather than conflicts.
What “market share efficiency” really means (in plain English)
Market share efficiency is your ability to convert effort and spend into a durable market share.
It shows up as:
- You grow without CAC exploding.
- You keep customers (retention) while adding new ones.
- You scale delivery without quality collapsing.
- You fund innovation without starving the core business.
This is systems thinking: optimise the whole, not one department.
Systems thinking: the building blocks (use these in all four systems)
A “system” isn’t a department. It’s a repeatable engine with:
- Inputs (data, resources, traffic, talent, capital)
- Processes (workflows, decisions, automation, handoffs)
- Outputs (value delivered: product, service, outcomes)
- Feedback loops (signals from customers, ops, finance, market)
- Constraints (bottlenecks that cap growth: people, tooling, cash, time)
- Metrics (leading + lagging indicators)
- Governance (decision rights, cadence, accountability)
When you apply these consistently, your company stops “guessing” and starts steering.
1) The Customer System: Create demand, deliver value, build loyalty
The goal
Turn insight into repeatable growth: Acquire → Activate → Retain → Expand → Refer
Key system elements
- Segmentation & positioning: Who you serve best, and why you win
- Customer discovery loop: Interviews, usability tests, win/loss reviews
- Acquisition engine: Channels that are measurable and repeatable (not “random virality”)
- Activation & onboarding: Time-to-value, aha moment, adoption
- Retention & expansion: Habit loops, lifecycle marketing, success playbooks
- Voice-of-customer signals: NPS/CSAT, churn reasons, support themes, product analytics
- Pricing & packaging clarity: Value communicated in a way customers actually understand
Real-world challenges (what breaks)
- Customers change faster than roadmaps—tastes, budgets, and “what good looks like” shift constantly.
- Noise overwhelms the signal. You get feedback, but it’s inconsistent unless structured.
- AI raises expectations. Users now expect personalisation, instant answers, and “it just works.”
2) The Operations System: Deliver reliably today, scale predictably tomorrow
The goal
Increase throughput without sacrificing quality: Speed + Consistency + Cost control
Key system elements
- Standardized workflows: Clear handoffs, definitions of done, fewer “hero saves”
- Capacity planning: People/time/tool constraints made visible
- Quality control: Testing, QA, review gates, operational dashboards
- Tooling & automation: Reduce manual work, reduce errors, shorten cycle time
- Knowledge system: Documentation, playbooks, searchable decisions, onboarding systems
- Incident & support model: Triage, SLAs, root-cause fixes, prevention
Real-world challenges (what breaks)
- Handoffs create hidden failure. Growth increases coordination costs.
- “Urgent” crowds out “important.” Without cadence and ownership, improvement never happens.
- Scaling exposes bottlenecks. The constraint moves (sales → delivery → support → hiring → finance).
3) The Profitability System: Fund the mission with sustainable economics
The goal
Build an engine that self-funds growth: Healthy unit economics + cash discipline + smart reinvestment.
Key system elements
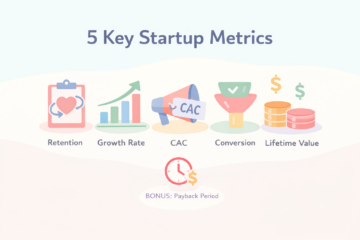
- Unit economics: LTV, CAC, payback period, gross margin
- Pricing strategy: Value-based pricing, packaging, discount rules
- Cost structure: Fixed vs variable costs, cost-to-serve by segment
- Cash flow management: Runway, working capital, collections, inventory (if applicable)
- Financial planning & forecasts: Scenario planning and triggers (“if churn rises, do X”)
- Investment allocation: Which bets get resources, and why
Real-world challenges (what breaks)
- Growth hides inefficiency. You can “grow into” bad margins until the market tightens.
- AI changes cost curves. Some functions get cheaper; others (data, infra, compliance) can spike.
- Wrong incentives. Teams optimise vanity growth instead of profitable growth.
4) The Innovation System: Keep adapting as technology and tastes evolve
The goal
Continuously reinvent value without destabilising the core: Explore → Validate → Scale
Key system elements
- Innovation pipeline: Idea intake → prioritization → experiments → rollout
- Experiment design: Hypotheses, success metrics, fast feedback, kill rules
- Customer + tech radar: What users are shifting toward and what tech enables next
- Product strategy & roadmap: Clear bets tied to outcomes, not feature lists
- Learning system: Post-mortems, retros, decision logs, reusable patterns
- AI-native leverage: Automation, copilots, agents, and data loops embedded in how work happens
Real-world challenges (what breaks)
- Shiny object syndrome. New tech tempts teams to build what’s cool, not what wins.
- Innovation debt. Too many experiments with no operational path to scale.
- AI-native competitors move faster. Smaller teams can ship faster using automation and agents.
AI-native startups and modern org structures: what’s changing
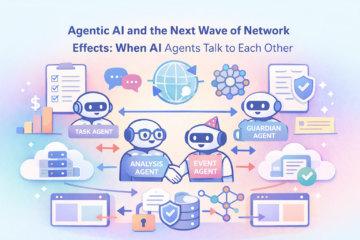
AI-native companies often win by redesigning how work is done, not just adding tools.
Common patterns:
- Smaller, outcome-owned teams: People “own outcomes” (activation, retention, cycle time) rather than functions.
- AI as a production layer: Copilots and agents embedded into support, research, analytics, QA, sales ops.
- Decision velocity as a metric: Faster iteration loops, fewer committees, clearer ownership.
- Data flywheels: Product usage generates data → improves model/personalisation → improves product → grows usage.
The risk: if you add AI without system alignment, you just get faster chaos.
The alignment principle: how the four systems reinforce each other
Alignment means your company is not running four separate engines—it’s running one connected machine:
- Customer insights shape the roadmap (Innovation)
- Innovation is built into repeatable delivery (Operations)
- Operations efficiency protects margins (Profitability)
- Profitability funds experimentation (Innovation)
- Innovation improves customer outcomes (Customer)
…and the loop tightens.
If you feel friction, it’s usually misalignment, like:
- Sales promises outrun delivery capacity (Customer vs Operations)
- Product ships features nobody will pay for (Innovation vs Profitability)
- Cost cuts destroy customer experience (Profitability vs Customer)
A practical KPI dashboard (one per system)
| System | Leading indicators (predict the future) | Lagging indicators (confirm results) |
|---|---|---|
| Customer | Activation rate, time-to-value, demo-to-trial conversion, onboarding completion | Retention, churn, expansion revenue, NPS/CSAT |
| Operations | Cycle time, backlog health, incident rate, automation rate | Delivery SLA, defect rate, cost-to-serve |
| Profitability | LTV/CAC, payback period, gross margin per segment, forecast variance | Net margin, burn multiple, runway, cash flow |
| Innovation | Experiment velocity, % roadmap tied to outcomes, learning cycle time | New revenue contribution, adoption of new capabilities |
Action plan: assess your strengths and find your highest-impact improvements
Step 1: Score your current maturity (15-minute scorecard)
Score each statement 0–5 (0 = not true, 5 = consistently true).
Customer System
- We can clearly name our #1 customer segment and their top 3 problems.
- Our acquisition channels are measured and repeatable.
- We know why customers churn (and have a plan to reduce it).
- Pricing and packaging match real perceived value.
Operations System
- Workflows are documented and consistent across teams.
- We track cycle time and quality in a simple dashboard.
- Support/incident handling has clear triage and owners.
- Automation reduces manual work every month.
Profitability System
- We know LTV/CAC and payback by segment.
- We understand cost-to-serve and margin drivers.
- We run scenarios (best/base/worst) and act on triggers.
- Budget follows strategy, not politics.
Innovation System
- We run experiments with hypotheses and kill rules.
- Roadmap items link to measurable outcomes.
- We have a way to evaluate new tech (including AI) without distraction.
- Learning is captured (so we don’t repeat mistakes).
Interpretation
- 0–10: fragile system (high risk)
- 11–16: functioning but inconsistent
- 17–20: strong and scalable
Step 2: Find your constraint (the one bottleneck that caps growth)
Ask: “If we doubled demand next month, what breaks first?”
That answer is your constraint—fix it before optimising everything else.
Common constraints:
- Lead quality/positioning (Customer)
- Delivery throughput/handoffs (Operations)
- Margins/cash conversion (Profitability)
- Slow iteration / unclear bets (Innovation)
Step 3: Pick one “keystone initiative” per system (don’t boil the ocean)
Choose one improvement per system that unlocks compounding benefits.
Examples:
- Customer: tighten ICP + onboarding to cut time-to-value by 30%
- Operations: reduce cycle time with clearer definitions + automation
- Profitability: rebuild pricing/packaging and reduce cost-to-serve by segment
- Innovation: install an experiment pipeline (2–4 experiments/month)
Step 4: Run a 30-60-90 day execution plan
Days 1–30: Instrument + stabilise
- Build a one-page dashboard (KPIs above)
- Document 3 core workflows (sales→delivery, support, release)
- Capture top 20 customer insights (churn + wins + objections)
Days 31–60: Remove bottlenecks
- Fix the #1 constraint with one cross-functional squad
- Introduce weekly operating cadence (metrics review + decisions)
- Implement 2–3 automations (support triage, reporting, QA, research)
Days 61–90: Scale what works
- Expand playbooks across the org
- Double down on the best channel + the best segment
- Promote successful experiments into the core roadmap
Step 5: Lock alignment with a simple operating model
- North Star Metric (one)
- System KPIs (4 dashboards)
- Decision rights (who owns what outcomes)
- Cadence (weekly metrics, monthly strategy, quarterly bets)
- Learning loop (retros + decision log)
The takeaway
Startups don’t lose because they lack ideas. They lose because their systems fight each other. When you intentionally design the Customer, Operations, Profitability, and Innovation systems—and align them—you create a durable machine that:
- Solves real problems
- Scales delivery
- Sustains margins
- Adapts faster than the market
If you want, I can turn your answers to the scorecard into:
- a radar chart-style narrative (strengths vs gaps),
- a prioritised backlog of initiatives,
- and a 90-day OKR set (one per system).