Founders can measure hundreds of things—traffic, clicks, MRR, DAUs, feature usage, NPS, pipeline… but early-stage momentum usually comes down to a small set of fundamentals.
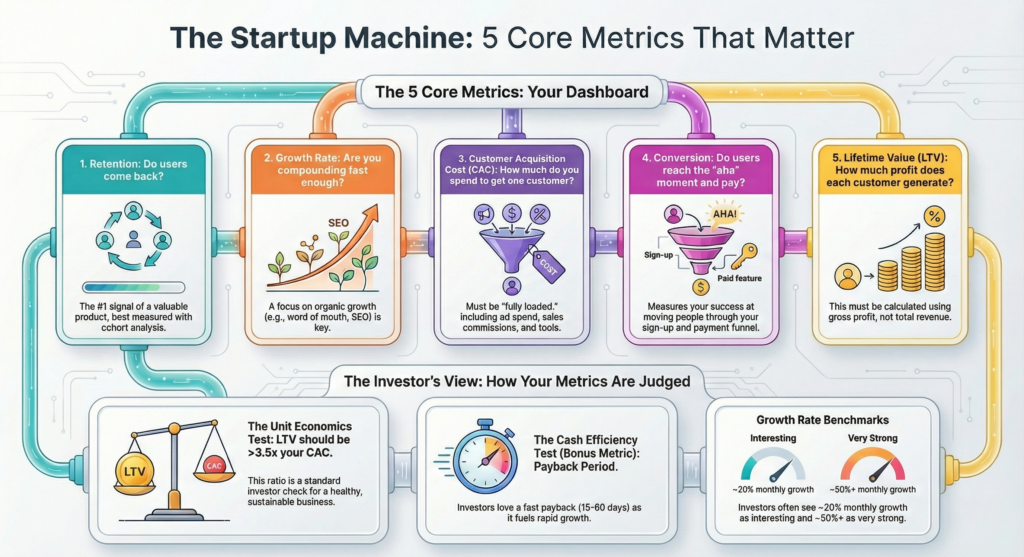
After reviewing thousands of companies (and building a few), most tech startups can sanity-check their trajectory with five core metrics:
- Retention
- Growth rate
- Customer acquisition cost (CAC)
- Conversion
- Lifetime value (LTV)
Plus one bonus metric investors love: Payback Period.
This guide explains what each metric means, how to calculate it, typical pitfalls, and what to do when the number is weak.
Why these five metrics matter
A startup is basically a machine that:
- attracts users (growth + CAC),
- converts them (conversion),
- keeps them (retention),
- and makes money sustainably (LTV + payback).
If any one of those breaks, growth becomes expensive, churn becomes a leak, and fundraising gets harder.
1) Retention: the #1 signal of a big business
Retention answers the most critical question:
Do people come back—and keep coming back—because the product is valuable?
Retention looks different depending on your model:
- Free products: Do users return to view, click, create, or interact?
- SaaS/subscriptions: Do customers keep paying and keep using the product?
- Hybrid models: Are users paying but barely using (a churn risk)?
How to measure retention
The gold standard is cohort retention:
- Group users by the week/month they started (a cohort)
- Track what % are still active after N days/weeks/months
Common views:
- Cohort tables (“triangle charts”) showing retention curves over time
- Churn (for paid products): the % that cancel per month
Retention also includes frequency
Not every product needs daily usage. Your job is to define the “ideal” frequency:
- daily (habits),
- weekly (workflows),
- monthly (billing/finance),
- occasional (travel, property, major purchases)
Then design onboarding + UX to pull users toward that frequency.
Pitfall: celebrating signups while retention is flat. If retention is weak, you’re pouring water into a leaky bucket.
2) Growth rate: Are you compounding fast enough?
Growth rate is the rate at which the business expands—users, revenue, usage, supply, bookings, etc.
There are many ways to grow, but the best businesses reduce dependency on paid acquisition and win with organic growth:
- Word of mouth
- PR / influencers / “earned media”
- SEO (free traffic from search)
- partnerships
- product-led loops
Viral growth (K-factor) ≠ network effects
Viral engineering is about users bringing more users through deliberate product loops. The K-factor often measures it:
- K-factor ≈ invites per user × invite conversion rate
Even a K-factor like 0.1–0.2 can meaningfully reduce CAC over time.
A practical early-stage benchmark (investor-style)
Some seed investors use rough monthly growth heuristics like:
- ~10%: likely too slow
- ~20%: maybe worth a look
- ~30%: getting interesting
- ~50%: very strong
- ~80–100%: “drop everything” territory
(These are not universal rules—just a typical pattern of what gets attention.)
3) CAC: What does it cost to acquire a paying customer?
CAC (Customer Acquisition Cost) is how much you spend to get a new customer.
Basic formula:
- CAC = (Sales + Marketing spend) / # of new customers acquired
The key is “fully loaded CAC”
Many founders undercount CAC by only including ad spend.
A more realistic CAC can include:
- ad spend
- discounts/coupons
- sales commissions
- onboarding/support labour (especially in B2B)
- tools and agency costs
Pitfall: “Our CAC is £10 because that’s what we spend on ads.”
If you needed a human call, a discount, and onboarding time, CAC is higher.
What “good” looks like: a scalable channel with decreasing CAC over time—ideally pulled down by organic and viral loops.
4) Conversion: do users reach the “aha” moment and pay (or activate)?
Conversion tracks how well you move people through your funnel:
- visit → signup
- signup → activated user
- activated user → paying customer
- paying customer → retained customer
Example funnel metrics:
- landing page conversion
- activation rate (reaching the “aha” moment)
- trial-to-paid conversion
- checkout conversion
Special case: marketplaces (liquidity)
Marketplaces are different because they have two sides (supply and demand). Conversion is often called liquidity:
- Supply-side liquidity: % of listings that sell
- Demand-side liquidity: % of buyers who find something and transact
Together, they represent the marketplace’s “engine turning over.”
Pitfall: measuring only one side. Marketplaces fail when one side converts, and the other doesn’t.
5) LTV: How much profit do you earn per customer over their lifetime?
LTV (Lifetime Value) estimates how much value a customer generates over time.
A simple subscription approximation:
- LTV = ARPU × Gross Margin × Average customer lifetime
For transaction businesses, you often use AOV (Average Order Value) plus repeat frequency:
- LTV ≈ (AOV × take rate × gross margin) × purchase frequency × years retained
Don’t confuse revenue with value
LTV should be based on gross profit, not total revenue.
You need real dollars left to pay salaries and keep the lights on.
LTV: CAC ratio (unit economics)
A standard unit economics check:
- LTV:CAC = LTV / CAC
Many investors look for ~3.5x+ as a “healthy” starting point (varies by model, margins, payback, and growth stage).
Bonus metric: Payback period (often more critical than LTV & CAC)
Payback period answers:
How fast do we earn back what we spent to acquire a customer?
- Payback period = CAC / monthly gross profit per customer
If payback is 15–60 days, you can recycle cash into growth quickly.
A high LTV doesn’t help as much if it takes 18 months to recover CAC.
A simple “startup metrics dashboard” to implement this week
Track these weekly (early stage) or monthly (later stage):
Retention
- cohort retention (week 1, week 4, week 12)
- churn (logo churn + revenue churn) if paid
Growth
- MoM growth in your north-star metric (users, MRR, GMV, bookings)
- organic vs paid split
- K-factor (if relevant)
CAC
- paid CAC and blended CAC
- CAC by channel
- fully loaded CAC estimate
Conversion
- activation rate
- trial→paid (or signup→purchase)
- marketplace liquidity (supply + demand)
LTV + Payback
- gross margin
- LTV (profit-based)
- LTV: CAC
- payback period
What to do when a metric is weak (quick diagnosis)
- Low retention: fix onboarding, narrow ICP, improve core loop, reduce time-to-value
- Low growth: find a repeatable channel, tighten positioning, build referral loops, invest in SEO/content
- High CAC: improve targeting, landing page conversion, sales efficiency, product-led acquisition
- Low conversion: improve activation, remove steps, improve pricing/packaging, test offers
- Low LTV: improve retention, expand usage, upsell/cross-sell, increase margins
- Slow payback: raise prices, reduce CAC, increase gross margin, shorten sales cycle
Culture matters: metrics literacy is a leadership job
The highest-performing teams treat metrics as a shared language:
- CEO and leadership know the numbers cold
- Dashboards are visible
- Trends are reviewed in meetings
- definitions are consistent (no “metric drift”)
This is how you move faster: measure, learn, iterate.