Power Laws for Startups: How to Escape the Graveyard and Reach 2% of TAM
Most startups do not fail because they were a bit worse than the competition. They fail because business outcomes follow power laws: a few companies capture almost all the value, and most get almost nothing. Design your company as if the world were linear and fair, and you become a statistic. Design for power laws, and you deliberately build the loops that push you into the winning tail: 2% of your total addressable market (TAM), rising market share efficiency and compounding cash flow.
What a power law is, and where it shows up
In a power law, a small number of inputs account for most of the outputs, and extreme outcomes are rare but not that rare. That is very different from a normal distribution, where results cluster around the average. In a power-law world, “pretty good” is not enough: you either excel at a few things that compound, or you fade.
| Where | What it looks like | What to do |
|---|---|---|
| Outcomes | A handful of companies produce most returns. Most end as write-offs or small exits. | Pick a strategy that gives you a real shot at the tail, not “one of many okay options”. |
| Attention | A few channels, pages and messages drive most traffic and revenue. | Find your spikes, double down, and drop the noise. |
| Customers | Often 20% of customers drive 80% or more of revenue or profit. | Design for power users, super-fans and anchor clients, not the average customer. |
| Networks | Each new user, merchant or data source can raise value for all the others. | Build or plug into a network so growth makes the product better. |
Power laws cut both ways. One introduction or case study can change your trajectory, and a single customer or channel dependency can kill you. Your job is to raise the odds of a positive outlier and remove the single points of failure that could end you before compounding kicks in.
The three flywheels every startup needs
| Flywheel | The loop | The question to ask |
|---|---|---|
| Product learning | Use → data → insight → better product → more use | Does every new user make the product better for the next one? |
| Growth | New users → value delivered → proof and referrals → more users | Does every customer bring in the next three to five faster and more cheaply? |
| Monetisation | Value → willingness to pay → expansion → cash → more value | Does every extra euro of revenue make the next one easier to earn? |
Five rules to force compounding
- Retention first. If users don’t stay, nothing compounds. Make day-30 and day-90 retention must-win metrics before pouring fuel on acquisition.
- Capture and reuse data. Every interaction, ethically and compliantly, should make the next experience more personal, accurate or fast.
- Build network or pseudo-network effects. Profiles, content and liquidity, or templates, playbooks, integrations and benchmarks that improve with scale.
- Automate the loops. Turn one-off heroics into playbooks for sales, onboarding, expansion and referrals. Compounding that relies on heroes is fake compounding.
- Measure loops, not channels. Track how many new users the average customer brings in within 90 days, how much a cohort expands in 12–24 months, and how often a shipped feature lifts retention or revenue per user.
2% of TAM and market share efficiency
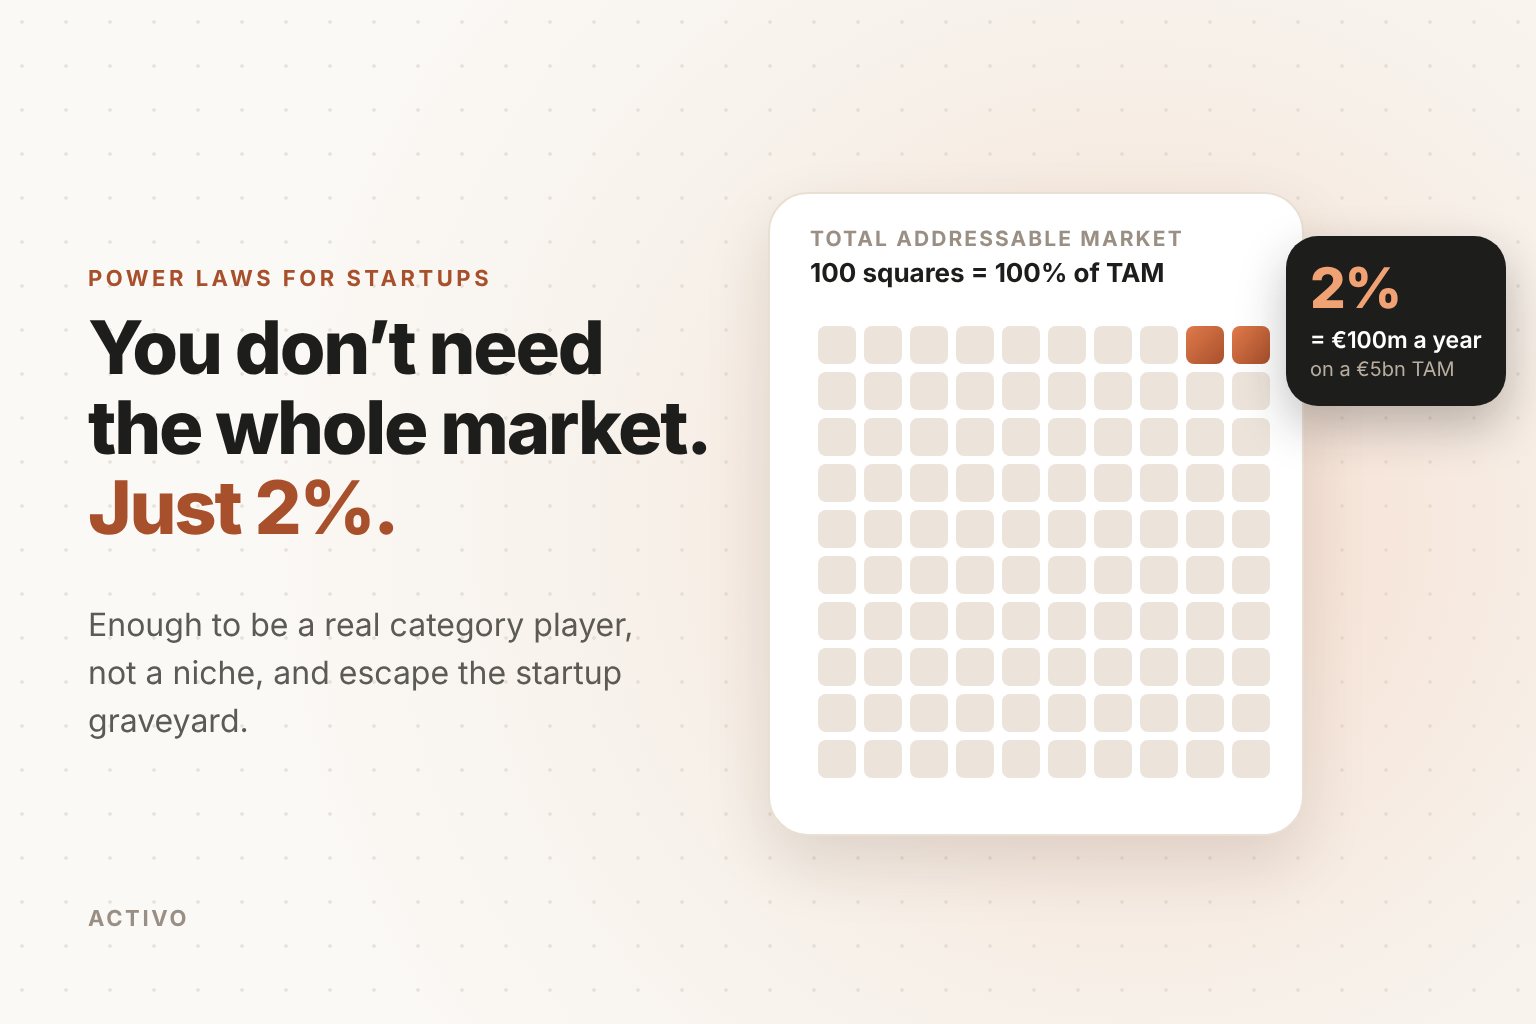
If your TAM is €5bn a year, 2% is €100m. At that scale you are no longer a niche: you can attract top talent and partners, influence customer expectations and outspend smaller rivals on product and brand. In power-law markets, category power often arrives at a low single-digit share.
The way you get there matters as much as the destination. Market share efficiency (MSE) = your market share ÷ your share of total category sales and marketing spend. With 4% of the market and 2% of category spend, your MSE is 2: twice as efficient as the average player. Rising MSE means your share is growing faster than your spend, which is the signature of brand, data and network effects at work.
| Annual growth rate | Years from €5m to €100m (2% of a €5bn TAM) |
|---|---|
| 30% | 11.4 years |
| 60% | 6.4 years |
| 100% | 4.3 years |
Run this sum for your own numbers every quarter. If the years to 2% of TAM are drifting out rather than shrinking, your loops are not compounding.
Five signals to review every quarter
| Signal | Check | Healthy |
|---|---|---|
| Escape velocity | Years to 2% of TAM at today’s growth and retention | Shrinking each quarter |
| MSE power | Market share ÷ share of category spend | Above 1 and rising |
| Retention gravity | Day-30, day-90 and 12-month logo and revenue retention | Cohorts flatten out; net revenue retention of 100% or more in your core wedge |
| Flywheel spin | New customers per customer, features that lift retention, expansion per cohort | Improving, not flat |
| Power users | Share of users above a power-usage threshold, and their NPS and referral rate | A rising share of power users with strong advocacy |
Your plan to reach 2% of TAM
- Pick a wedge you can dominate. A narrow industry, use case, geography or buyer where you can be number one or two, not one of twenty similar tools. You are creating a local power law in your favour.
- Spin one flywheel in that wedge. Land five to ten lighthouse customers, deliver quantified outcomes, and turn every implementation into a case study, referrals and internal expansion.
- Remove single points of failure. No customer above a set share of revenue, no single channel above a set share of pipeline, and best, base and worst-case plans for demand, churn and pricing.
- Expand into adjacent segments. Export your playbooks, templates and integrations, and move your positioning from “tool for X” to “the leader for problem Y”.
- Review the five signals every quarter. Look at concentration in top customers, channels and features, and ask of every initiative: “How does this make the next sale, feature or hire easier?”
You don’t have to be first to win, but you do have to compound fastest. A late entrant with better retention, a tighter network and higher MSE can still take the tail. You can’t opt out of power laws, but you can choose which side of them you end up on.
Escaping the graveyard starts with evidence. We help you prove what sells with real customers before you scale. Explore Product Market Fit →
We help founders pick their wedge, build the flywheels and track the signals that lead to 2% of TAM.
Get in touchSources: Seth Levine, Venture outcomes are even more skewed than you think (Correlation Ventures data); Wikipedia, Power law; Generative Value, A deep dive on the power law. Growth scenarios are illustrative.