5 Core Startup Metrics That Actually Matter
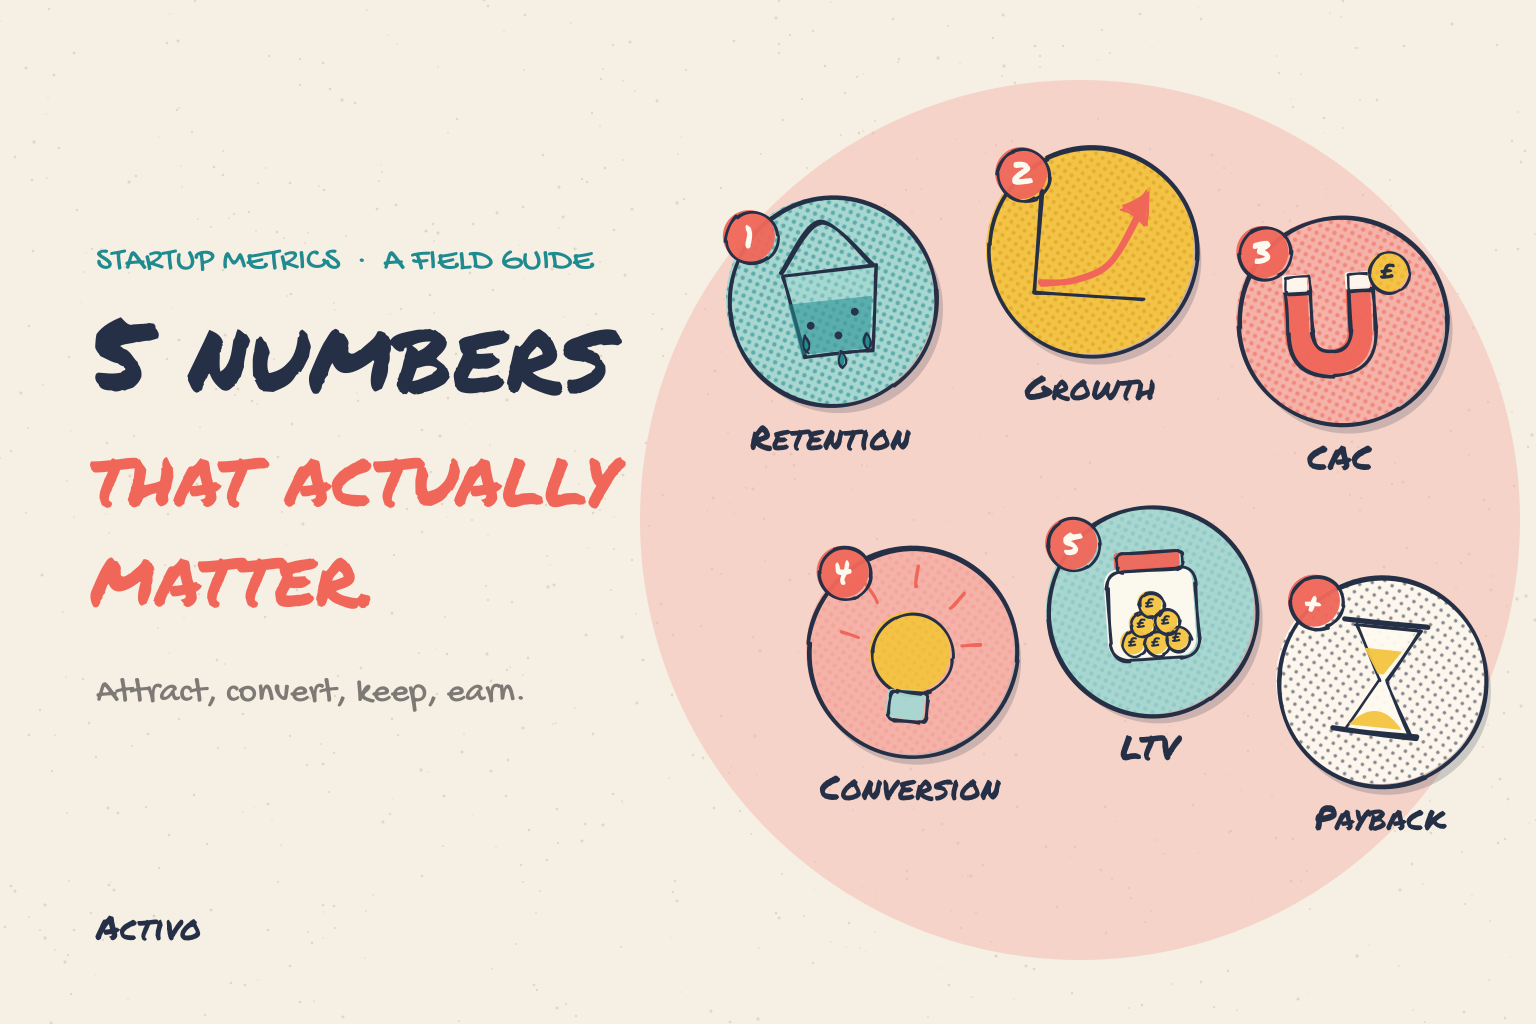
Founders can measure hundreds of things: traffic, clicks, MRR, daily users, feature usage, NPS, pipeline. Early-stage momentum usually comes down to five: retention, growth rate, customer acquisition cost (CAC), conversion and lifetime value (LTV), plus one that investors check first, payback period. This guide explains why each one matters, how to measure it, what good looks like today, which secondary metrics to watch, and how to turn them into a dashboard and a daily alert routine. Updated October 2026.
The five core metrics at a glance
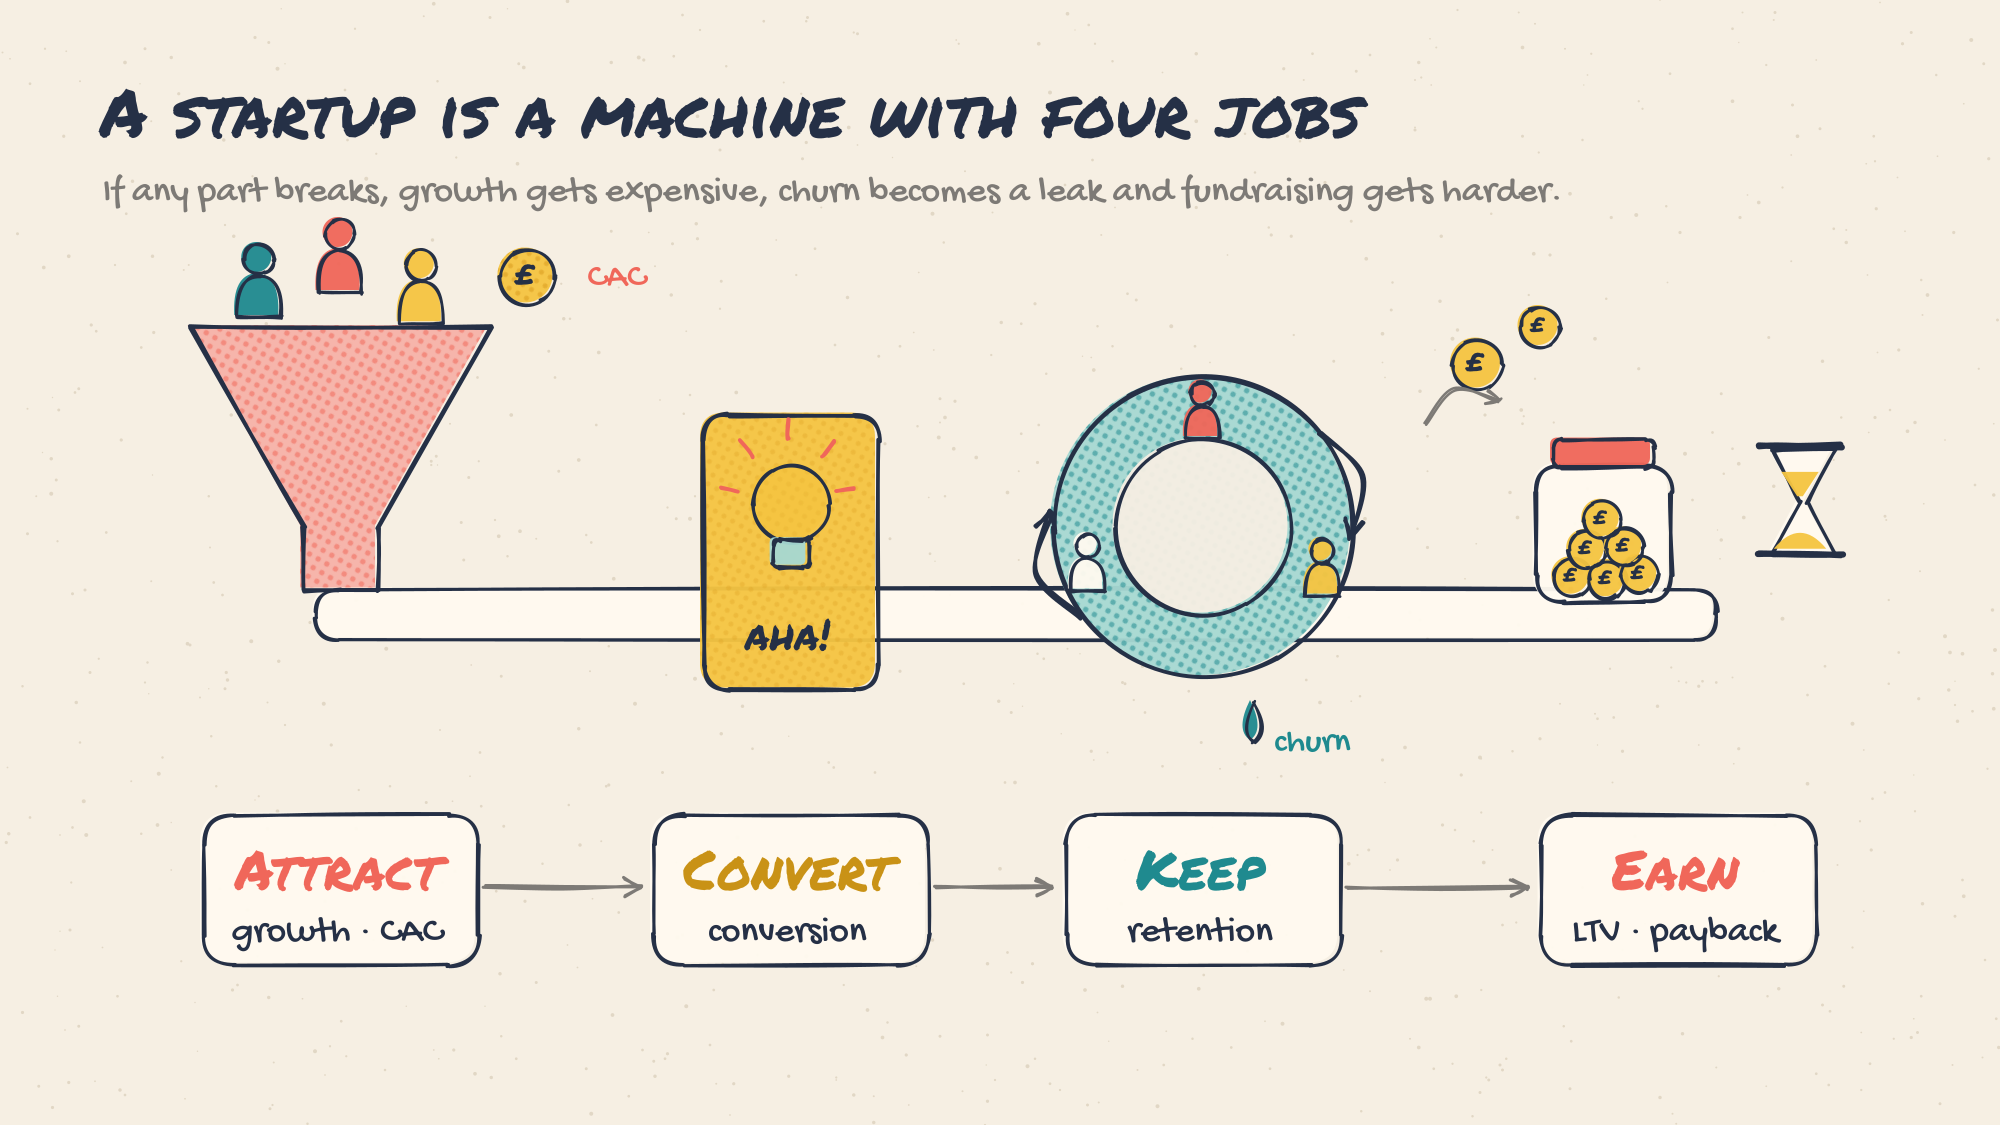
A startup is a machine that attracts users (growth and CAC), converts them (conversion), keeps them (retention) and earns more from them than they cost (LTV and payback). If one part breaks, growth gets expensive, churn becomes a leak and fundraising gets harder.
| Metric | The question it answers | Simple formula | Good early sign | Red flag |
|---|---|---|---|---|
| Retention | Do people keep coming back because the product is valuable? | Share of a starting cohort still active after N weeks or months | Cohort curves that flatten, not slide to zero | Signups rising while every cohort keeps decaying |
| Growth rate | Are we compounding fast enough to matter? | (This period minus last period) / last period | 15–30% a month at seed, mostly from repeatable channels | Growth that stops when paid spend stops |
| CAC | What does a paying customer really cost to win? | All sales and marketing cost / new paying customers | Falling over time as organic and referral share rises | Only counting ad spend |
| Conversion | Do users reach value and pay? | Users completing a step / users entering it | A clear aha moment most new users reach in their first session | Big drop between signup and first value |
| LTV | How much gross profit does a customer bring over their life? | Monthly revenue per customer × gross margin / monthly churn | LTV at least 3× CAC | LTV calculated on revenue, not gross profit |
| Payback period | How fast do we earn back what we spent to win a customer? | CAC / monthly gross profit per customer | Under 12 months, under 6 is excellent | Over 24 months with limited cash |
1. Retention: the strongest signal of a big business
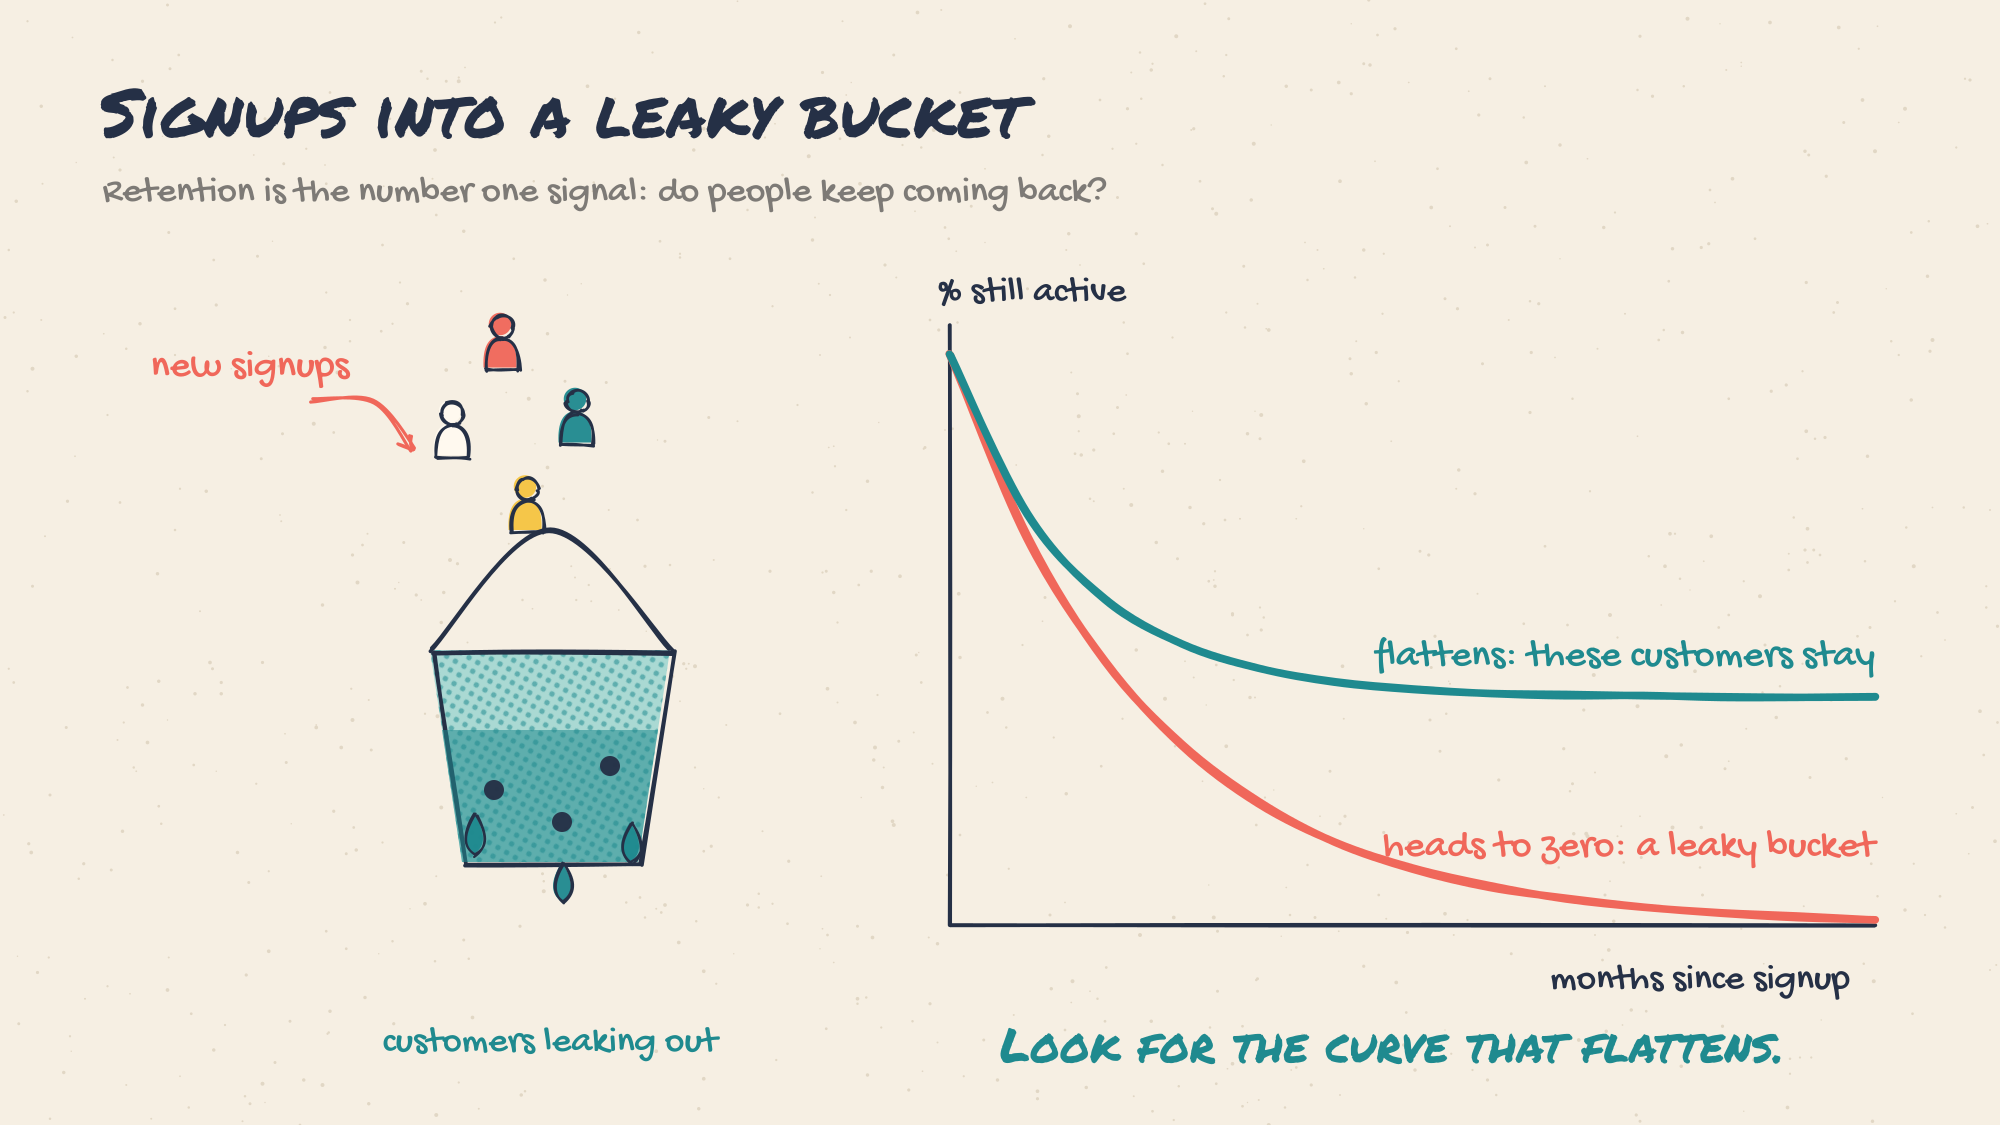
Why it matters: retention is the only metric that proves value rather than marketing. Every other number depends on it: growth stalls if customers leave as fast as they arrive, CAC never pays back if customers churn before month 12, and LTV is mostly a function of how long people stay. It also compounds the other way. With 101% median net revenue retention, the typical SaaS company has to replace almost all of its growth with new customers every year, while companies above 120% grow even if sales stop.
How to measure it: group users by the week or month they started (a cohort) and track the share still active after 1, 4 and 12 weeks. For paid products, also track logo churn (customers lost) and revenue churn (money lost). Define active by the frequency your product should have: daily for habits, weekly for workflows, monthly for billing or finance tools.
Pitfall: celebrating signups while retention is flat. Fix the leak before you pour in more water.
2. Growth rate: are you compounding fast enough?
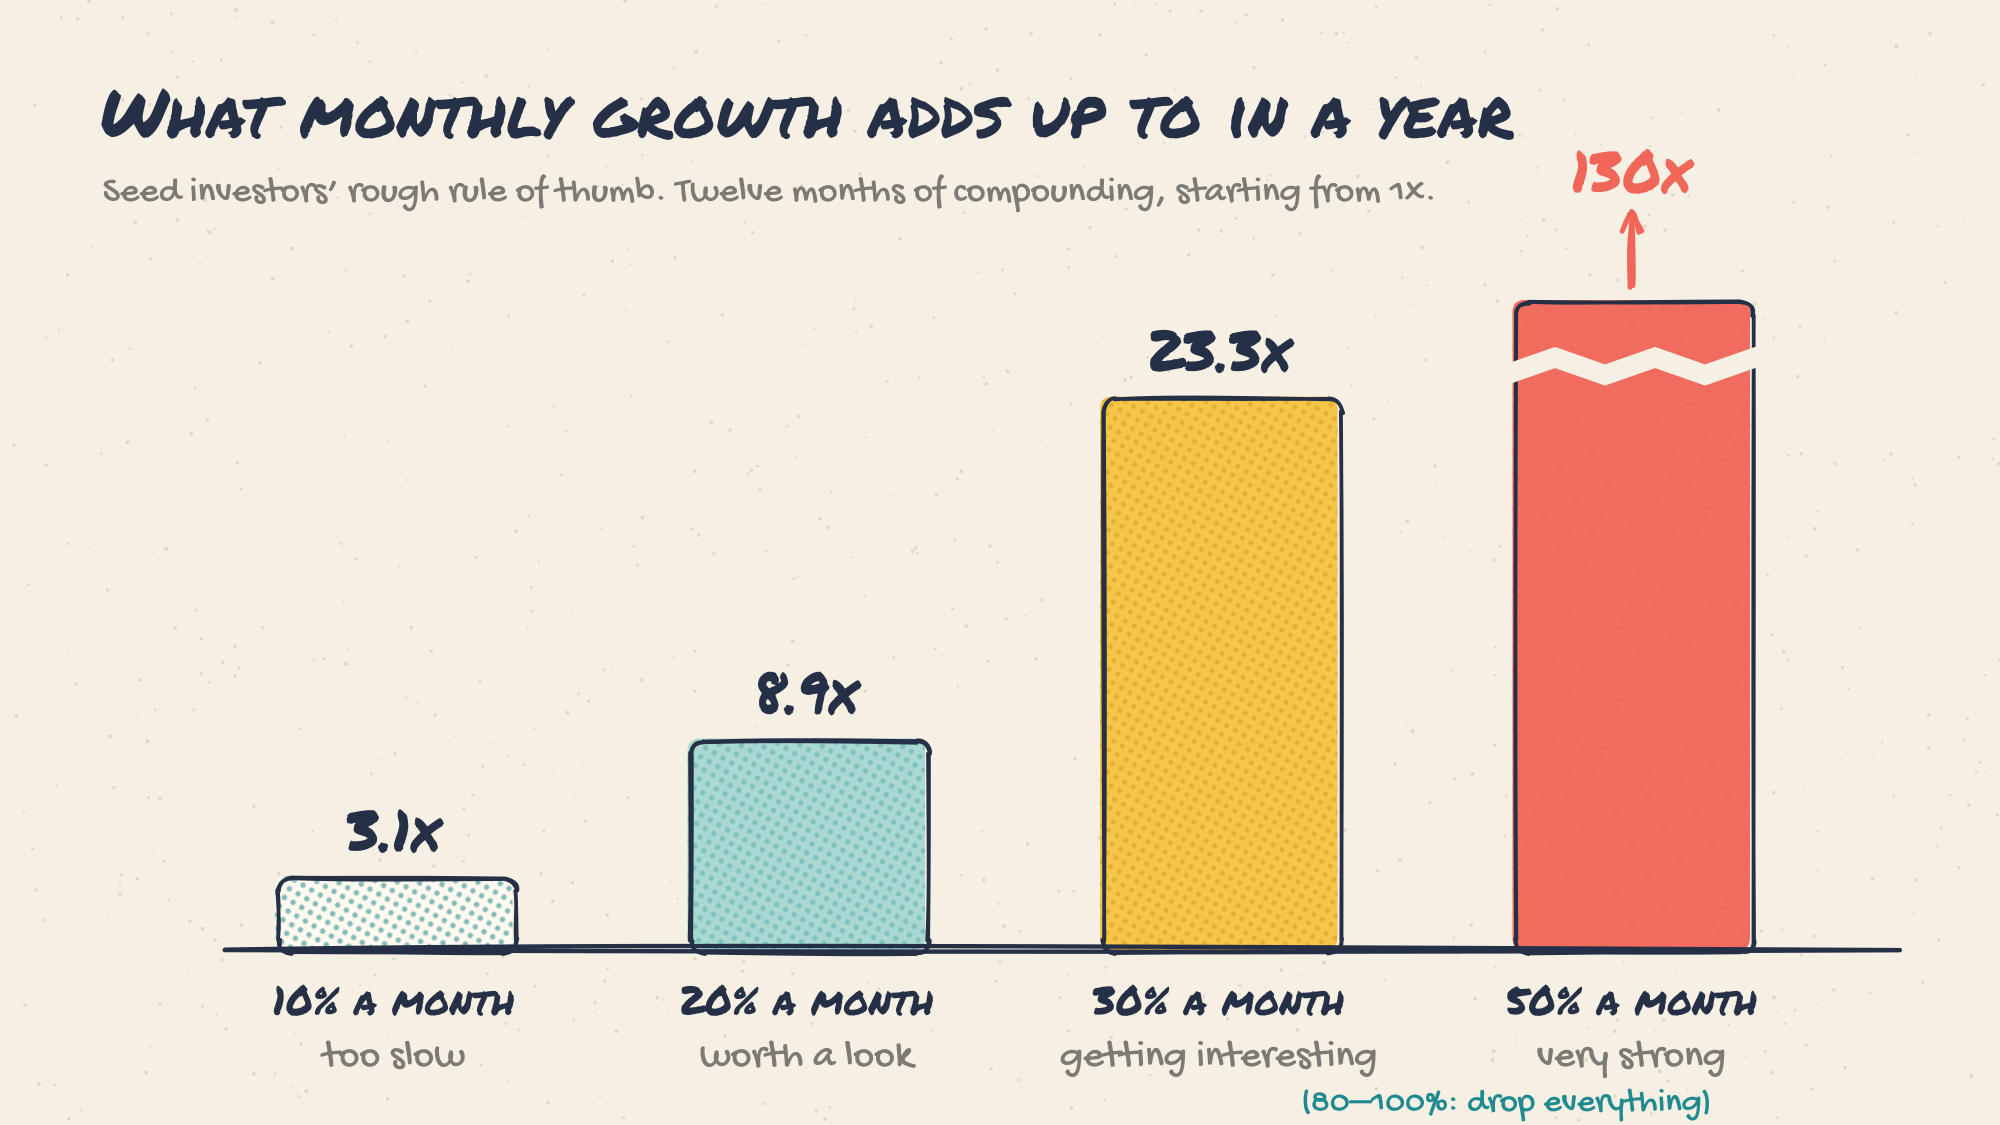
Why it matters: growth is what turns a good product into a venture-scale company, and small differences compound into huge gaps. Paul Graham’s rule of thumb for Y Combinator companies is 5–7% a week, which is roughly 24–34% a month. The best growth comes from channels that do not need more spend: word of mouth, search, partnerships, earned media and product loops where users invite users. Even a viral factor (invites per user × invite conversion) of 0.1–0.2 lowers CAC over time.
| Steady monthly growth | What it adds up to in 12 months | How investors tend to read it at seed |
|---|---|---|
| 5% | 1.8× | Too slow for venture funding |
| 10% | 3.1× | Healthy business, likely too slow for most seed funds |
| 20% | 8.9× | Worth a closer look |
| 30% | 23× | Strong |
| 50% | 130× | Exceptional, and rarely sustained for long |
Pitfall: measuring growth in a vanity number. Pick one north-star metric that reflects value delivered, such as MRR, weekly active teams, bookings or gross merchandise value, and report its growth every week.
3. CAC: what does a paying customer really cost?
Why it matters: CAC decides whether growth creates or destroys value. If it costs £3,000 to win a customer who brings £1,500 of gross profit before churning, every sale makes you poorer. At the median, B2B SaaS companies now spend $2.00 of sales and marketing to win $1.00 of new annual revenue, so efficiency is what separates fundable companies from the rest.
How to measure it: CAC = all sales and marketing cost / new paying customers. Use fully loaded CAC: ad spend, discounts, sales salaries and commissions, onboarding and support time, tools and agencies. Track paid CAC (paid channels only) and blended CAC (all customers), and break both down by channel.
Pitfall: “Our CAC is £10 because that is what we spend on ads.” If winning the customer also took a sales call, a discount and an onboarding session, your real CAC is several times higher.
4. Conversion: do users reach the aha moment and pay?
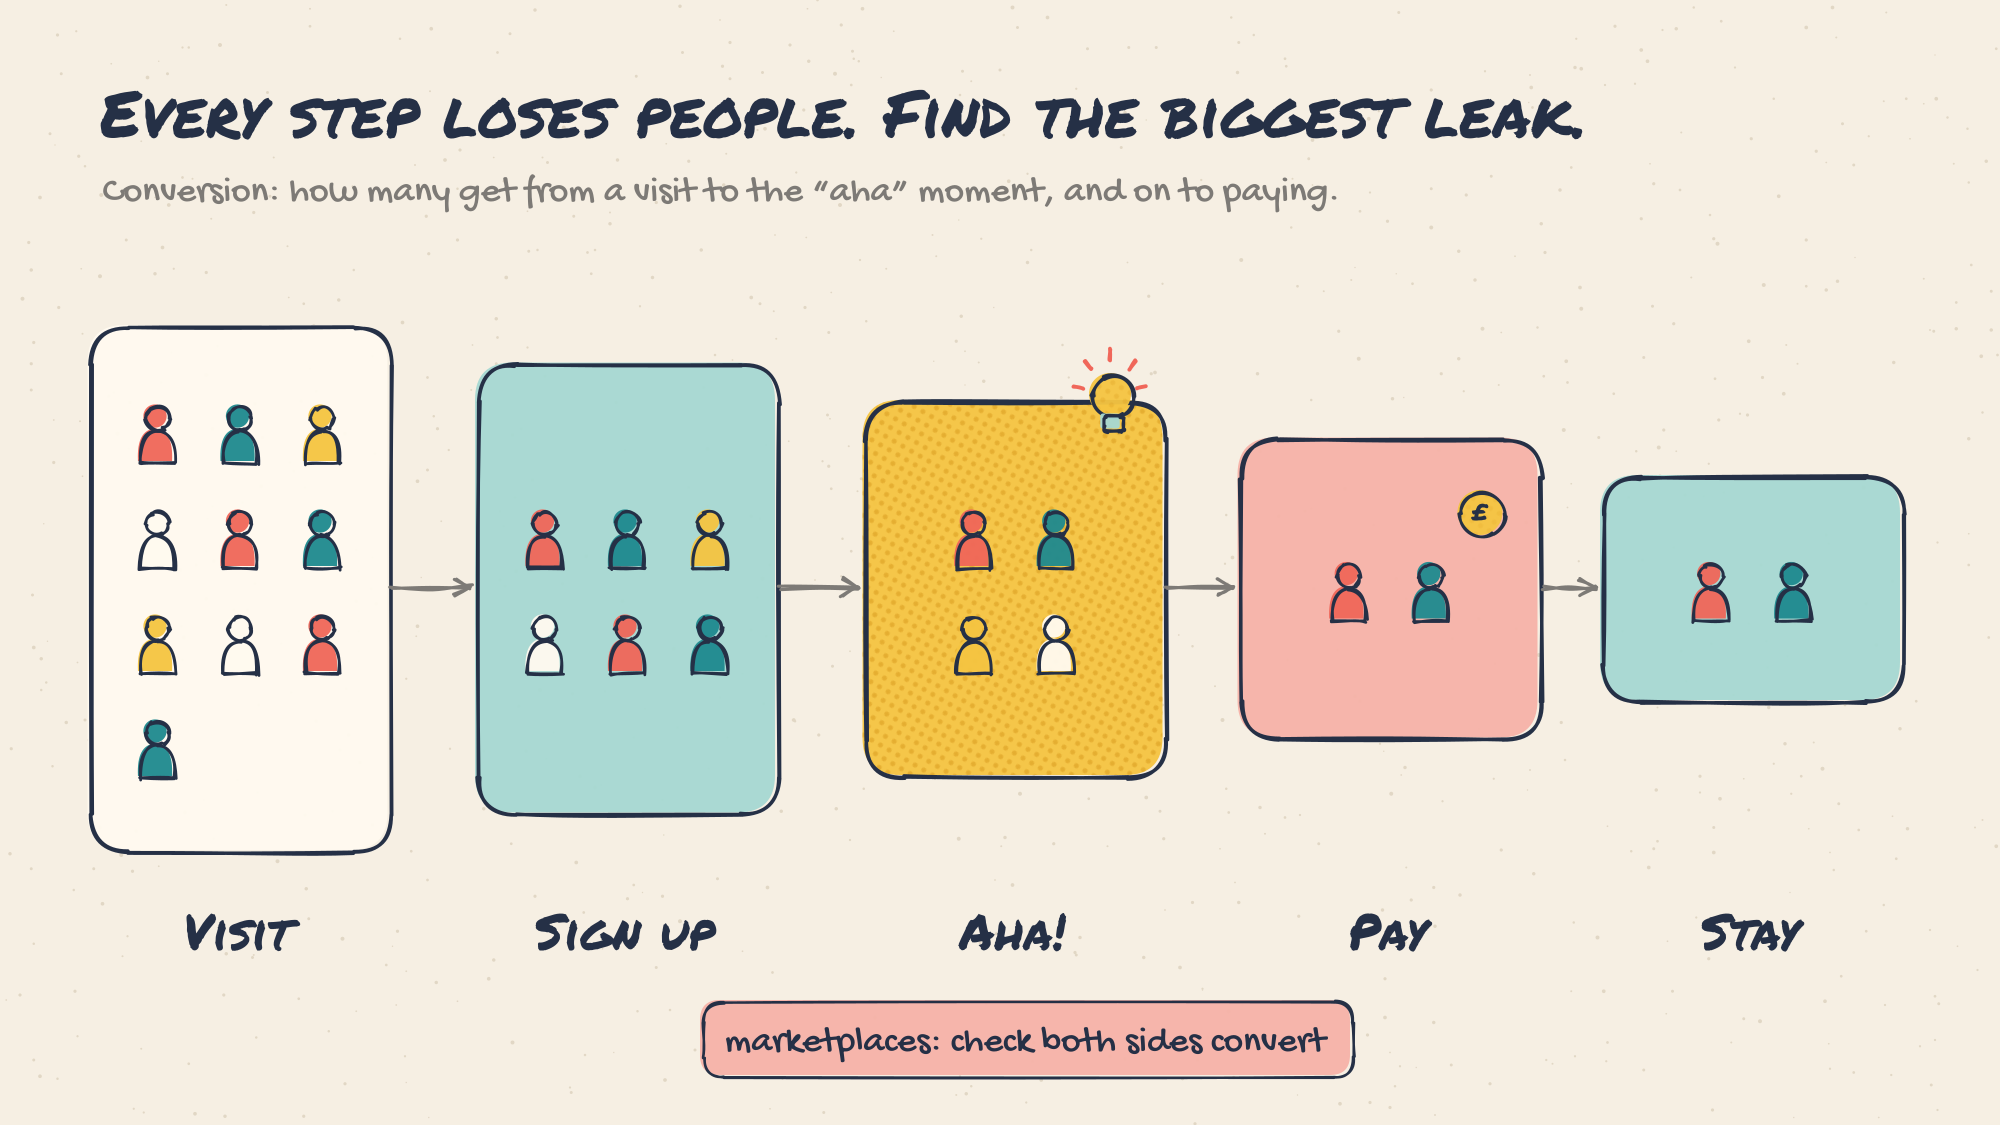
Why it matters: conversion is the cheapest growth lever you have. Doubling activation from 20% to 40% doubles the customers you get from the same traffic and halves your effective CAC, without spending more. It also shows where the product, not the marketing, is failing.
How to measure it: track each step separately: visit to signup, signup to activated (reaching the aha moment), activated to paying, and paying to retained. For marketplaces, conversion is liquidity, and you need both sides: the share of listings that sell (supply) and the share of buyers who find something and transact (demand).
Pitfall: measuring only one side of a marketplace, or only the final purchase. Most leaks happen between signup and first value.
5. LTV: how much profit does a customer bring?
Why it matters: LTV sets the ceiling on what you can afford to spend to win a customer. It turns retention, pricing and margin into one number, and paired with CAC it shows whether the business model works at all.
How to measure it: for subscriptions, LTV = monthly revenue per customer × gross margin / monthly churn rate. For transactions, LTV = average order value × take rate × gross margin × purchases per year × years retained. Always use gross profit, not revenue: a £100 customer at 30% margin is worth less than a £60 customer at 80%.
LTV to CAC: divide LTV by CAC. Around 3× is the usual benchmark for a healthy model, while above 5× often means you are under-investing in growth. Be wary of LTV figures built on a few months of data and an assumed five-year life.
Bonus: payback period, the metric cash cares about
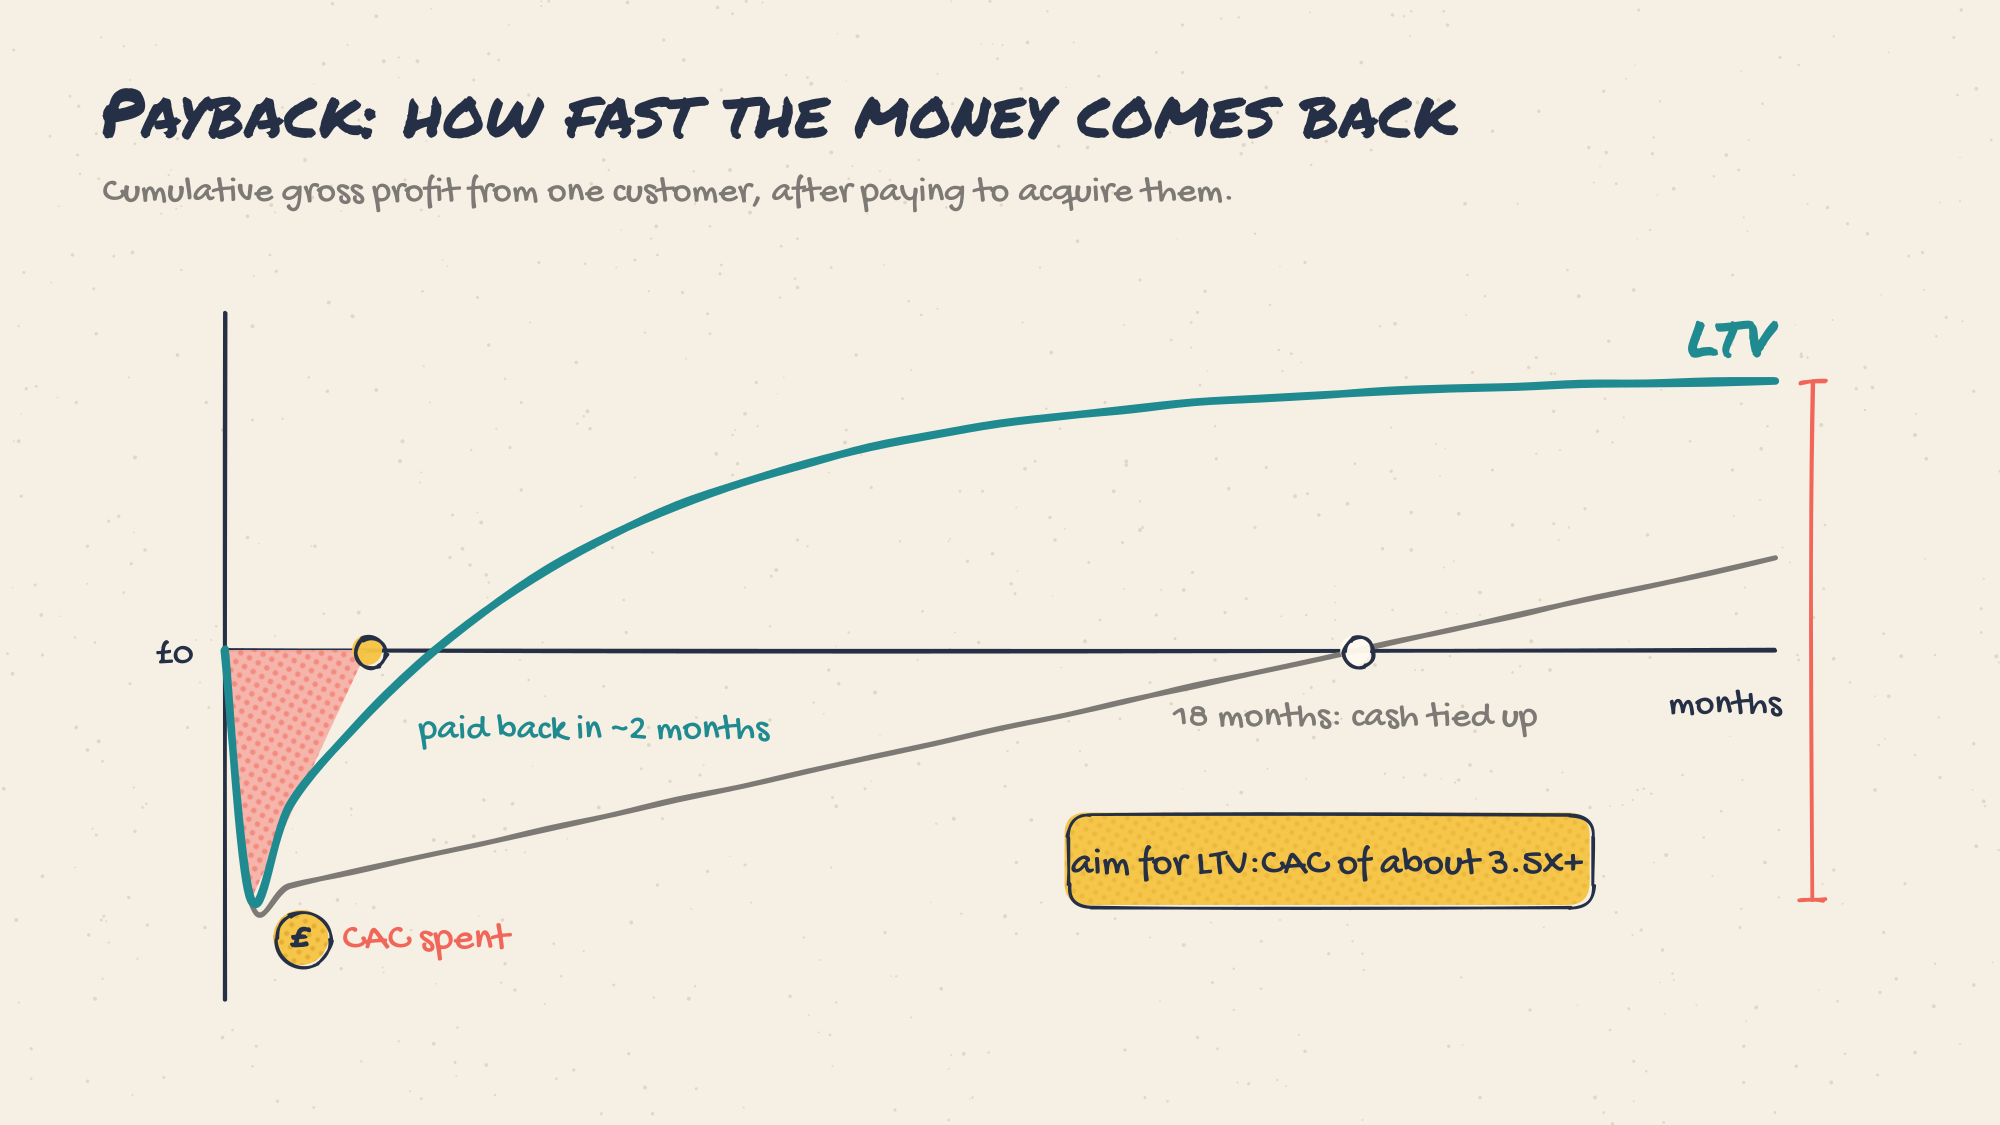
Why it matters: payback = CAC / monthly gross profit per customer. It tells you how long your cash is tied up in each new customer, which matters more than LTV when money is limited. The 2025 median was 16 months, with 11 months for products priced under $5k a year and 22 months for enterprise deals. Top-quartile companies pay back in six months or less, so they can recycle cash into growth twice a year.
Secondary metrics worth monitoring
Once the five core metrics are in place, add these to explain why the core numbers move. You do not need all of them: pick the ones that match your model and stage.
| Metric | Why it matters | Watch for |
|---|---|---|
| Revenue quality | ||
| Net revenue retention (NRR) | Shows whether existing customers grow, shrink or leave. Above 100% means growth even without new sales. | Below 100% while you report strong new sales |
| Gross revenue retention (GRR) | Revenue kept before upsells, so it shows true churn. The 2025 median was 88%. | Expansion from a few accounts hiding wider churn |
| Average revenue per account (ARPA) | Shows whether pricing and packaging are moving up-market or down. | Discounting creeping in to hit targets |
| Efficiency and cash | ||
| Gross margin | Sets how much of each pound can fund growth. Median subscription gross margin is about 81%. | AI and service costs pushing margin below 60% |
| Burn multiple | Net burn / net new ARR. Below 1 is excellent, above 2 is a warning. | Burn rising faster than new revenue |
| Runway | Months of cash left at current burn. Sets how long you have to hit milestones. | Under 12 months without a funding plan |
| Rule of 40 | Growth rate plus profit margin. A balance check once revenue passes a few million. | Both growth and margin falling at once |
| Engagement and funnel | ||
| Activation rate and time to value | Leading indicators of retention, visible weeks earlier. | Time to first value rising after product changes |
| Stickiness (daily or weekly users / monthly users) | Shows how habitual the product is. | Usage frequency below the job your product does |
| Pipeline coverage and win rate | For sales-led startups, predicts next quarter’s revenue. | Coverage under 3× target, or cycle lengthening |
| Customers and team | ||
| Net Promoter Score and support tickets per customer | Early warning of churn and product friction. | Rising tickets from your best-fit customers |
| Revenue concentration | Share of revenue from your top five customers. | Any single customer above 20% of revenue |
| Hiring plan vs actual and time to hire | Growth stalls when key roles stay open. | Critical roles open for more than 60 days |
What an ideal startup dashboard looks like
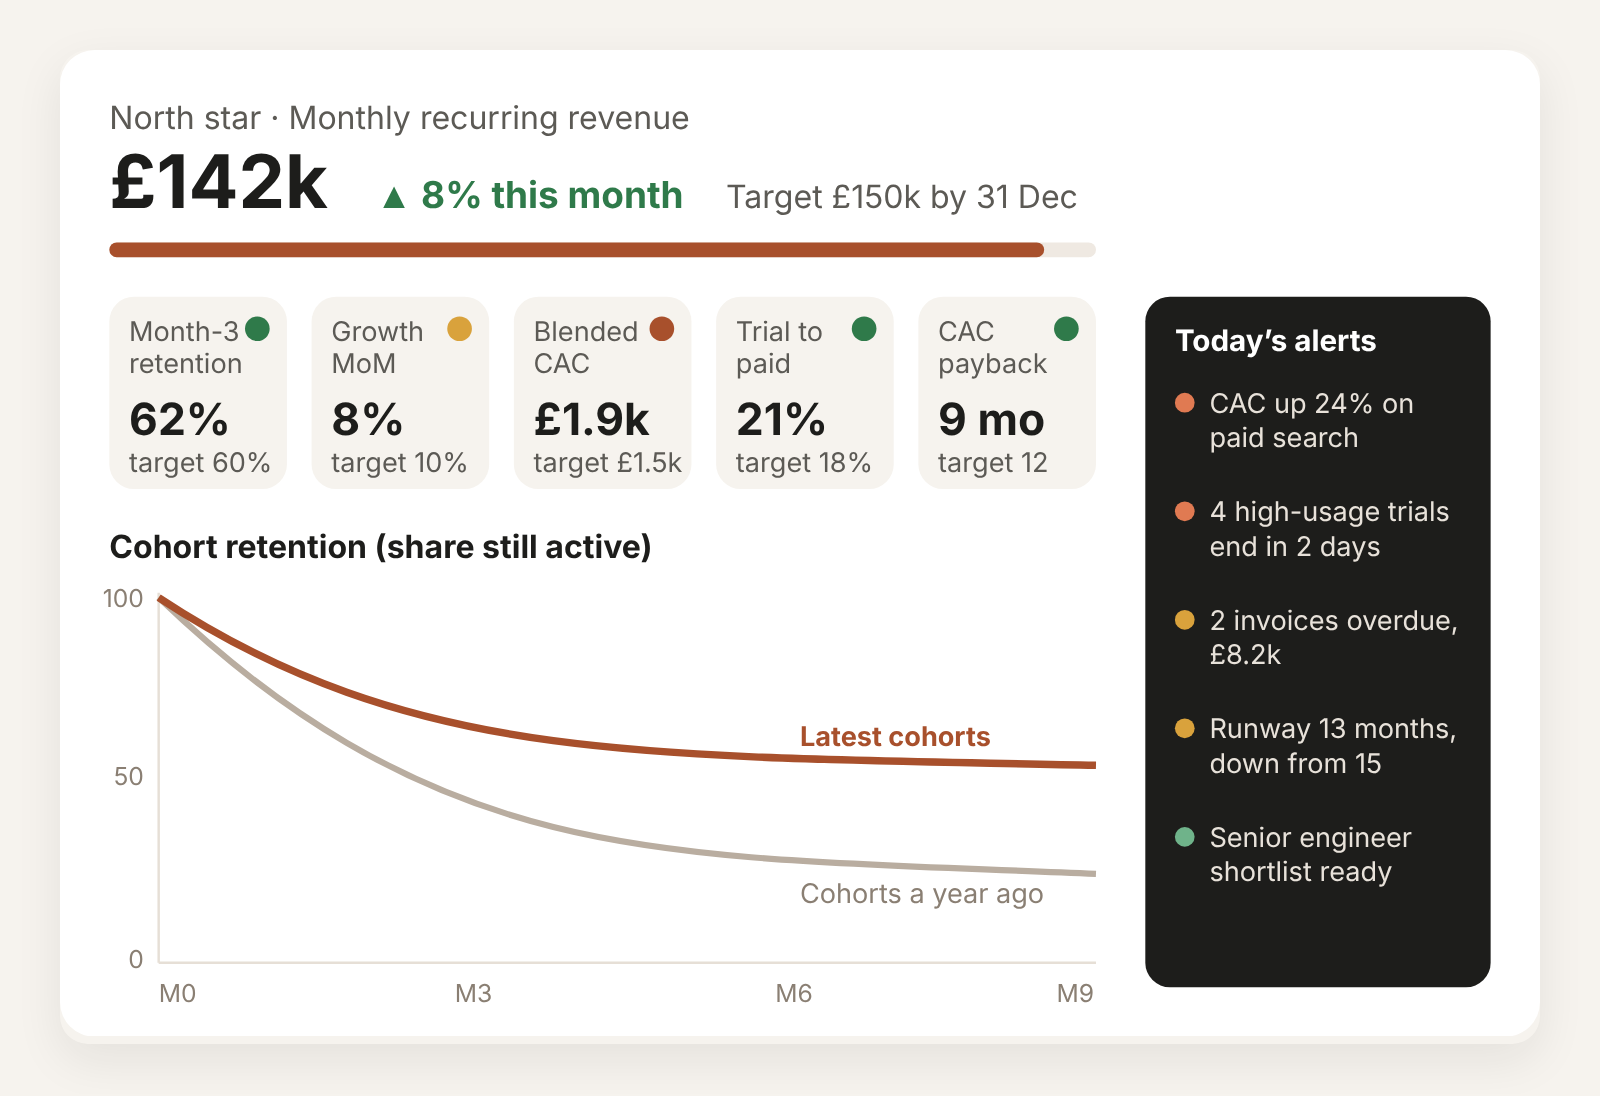
A good dashboard answers three questions in under a minute: are we on track, what changed, and what should we do about it? Keep it to one screen, put the north-star metric at the top, show every number against a target and a trend, and use the same definitions everywhere so the team never argues about what a number means.
| Layer | What goes there | How often to review |
|---|---|---|
| North star | The one number that best reflects value delivered, with target and trend | Daily glance, weekly review |
| Core five | Retention, growth, CAC, conversion, LTV and payback, each against a target | Weekly at early stage, monthly later |
| Drivers | Two or three secondary metrics that explain the core numbers, such as activation or NRR | Weekly |
| Cash | Burn, runway and burn multiple | Monthly, and on any big change |
| Alerts | Only what changed past a threshold, with a suggested action | Every morning |
Design rules: no more than about 12 numbers on the main view, every metric has an owner, targets are written down, and anything that has not changed is hidden. A dashboard nobody acts on is decoration.
Start each day with actionable alerts
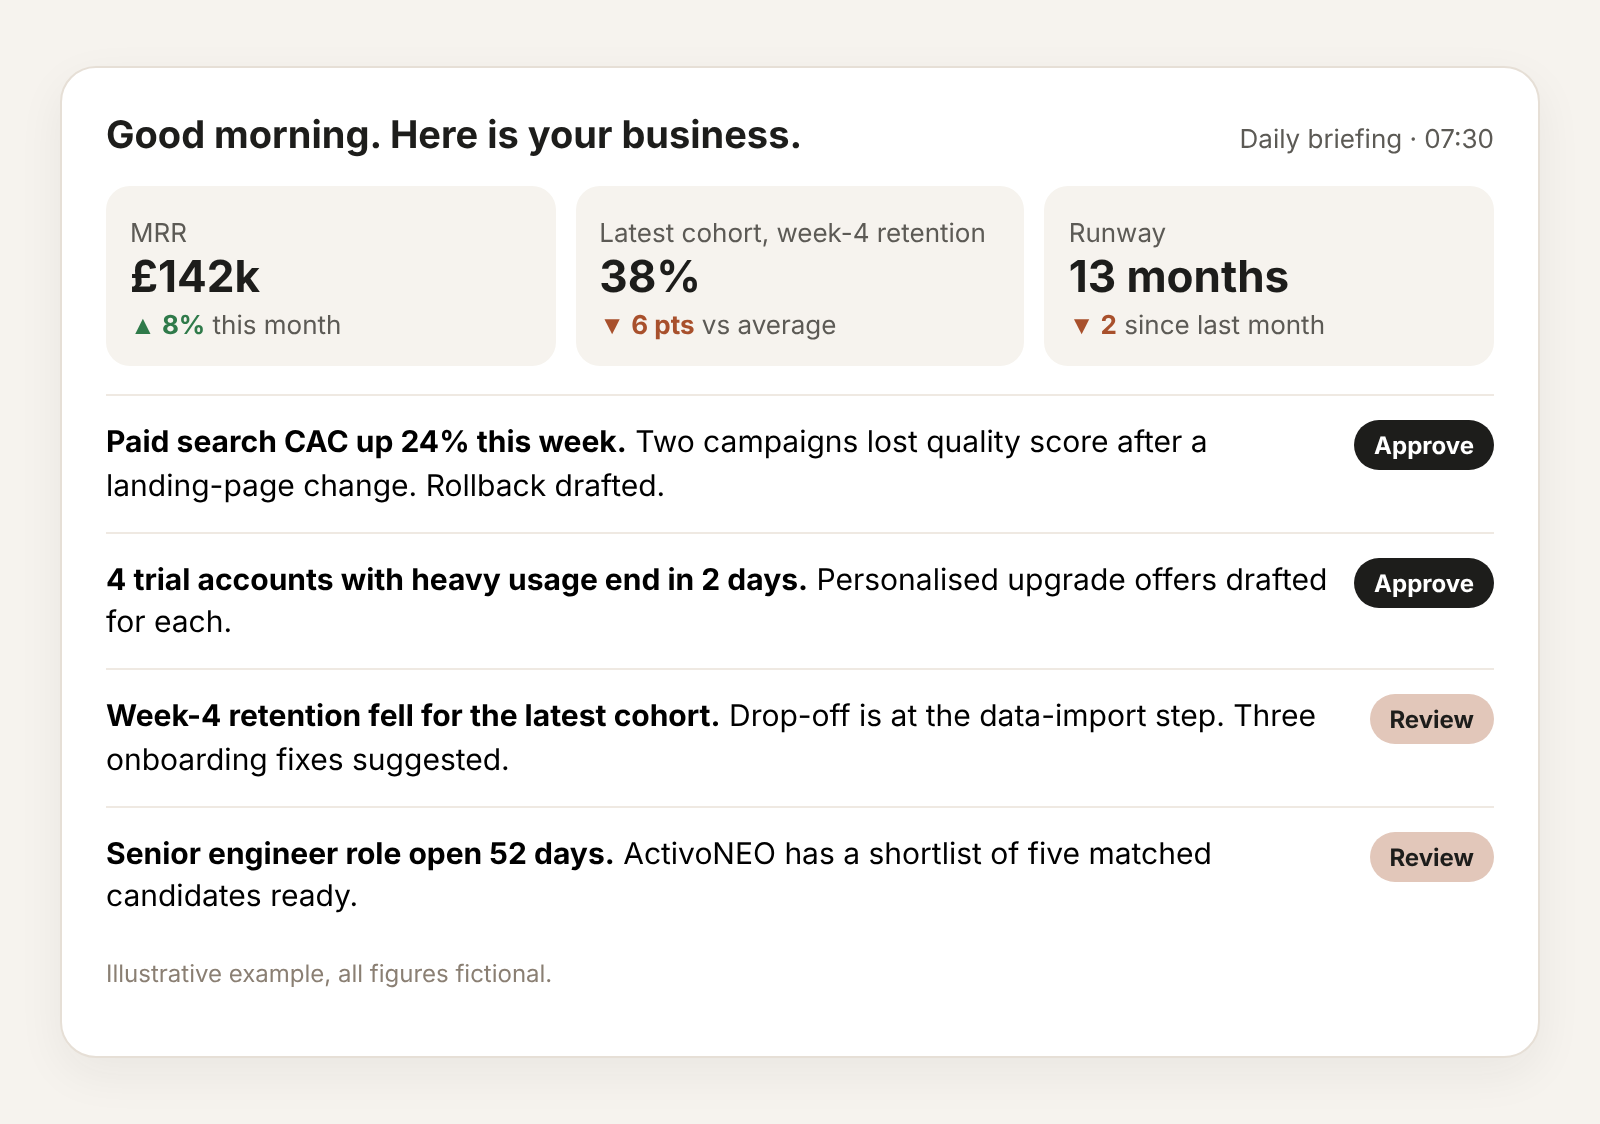
Dashboards still depend on someone remembering to look. The better routine is the reverse: the numbers come to you, and only when something needs a decision. That is how the 360 Orchestrator in ActivoCEO works. It monitors your KPIs, email, commitments and risks across the systems you already use, prioritises what needs attention today and delivers a five-minute daily briefing with an exception-based dashboard. Low-risk, reversible tasks run automatically, while consequential actions wait for your approval.
| Alert trigger | Why it matters | Suggested first action |
|---|---|---|
| Latest cohort retention falls more than 5 points below average | Earliest sign of a product or onboarding problem | Find the step where new users drop off and fix it before scaling spend |
| CAC on any channel rises more than 20% week on week | Spend is leaking before it shows in monthly numbers | Pause or cap the channel and check recent landing-page or targeting changes |
| Engaged trials ending without a payment method | Your warmest revenue is about to expire | Send a personalised offer or book a call before the trial ends |
| Payback rises above 12 months | Cash is being tied up in each new customer for longer | Review pricing, discounts and the channel mix |
| Runway drops below 12 months | Fundraising takes six months or more | Start the raise plan or cut burn now |
| A critical role stays open past 45 days | Missing people quietly slow every metric | Get a matched shortlist from ActivoNEO |
When a metric is weak: where to start
| Weak metric | First moves |
|---|---|
| Retention | Narrow your ideal customer, shorten time to value, fix onboarding and strengthen the core loop |
| Growth | Find one repeatable channel, sharpen positioning, add referral loops, invest in search and content |
| CAC | Tighten targeting, improve landing-page conversion, lift sales efficiency, add product-led acquisition |
| Conversion | Remove steps, improve activation, test pricing and packaging and offers |
| LTV | Improve retention, expand usage, add upsells and raise gross margin |
| Payback | Raise prices, cut CAC, improve margin and shorten the sales cycle |
Your 30-day metrics plan
- Days 1–3: Define your north star and the core five. Write one-line definitions for each, including what counts as an active user and a new customer, and agree them with the team.
- Days 4–10: Connect the data. Pull billing, product analytics, CRM and ad spend into one place. Calculate fully loaded CAC and gross margin from real costs, not estimates.
- Days 11–14: Build cohort views. Create monthly cohorts for retention and revenue, and compare your latest three cohorts with older ones.
- Days 15–20: Set targets and owners. Give each metric a target for the next quarter and a named owner. Add two or three secondary metrics that explain the weakest core number.
- Days 21–25: Build the one-page dashboard. North star on top, core five against targets, drivers and cash below. Hide anything nobody will act on.
- Days 26–30: Switch on daily alerts. Set thresholds for the triggers above so the exceptions come to you each morning, and review the dashboard with the team every week.
Tracking these metrics by hand? Actionable Analytics turns them into always-on dashboards and alerts that push the next action to the person who owns it. Explore Actionable Analytics →
ActivoCEO watches your KPIs around the clock, flags what changed and drafts the next step. ActivoNEO helps you fill the roles that move those numbers.
Discover ActivoCEO Discover ActivoNEOSources: Benchmarkit, 2025 B2B SaaS Performance Metrics Benchmarks · Aleph and Benchmarkit, CAC payback benchmarks 2026 · Paul Graham, Startup = Growth. Dashboard and briefing examples are illustrative.