TAM, SAM, SOM: Do they matter?
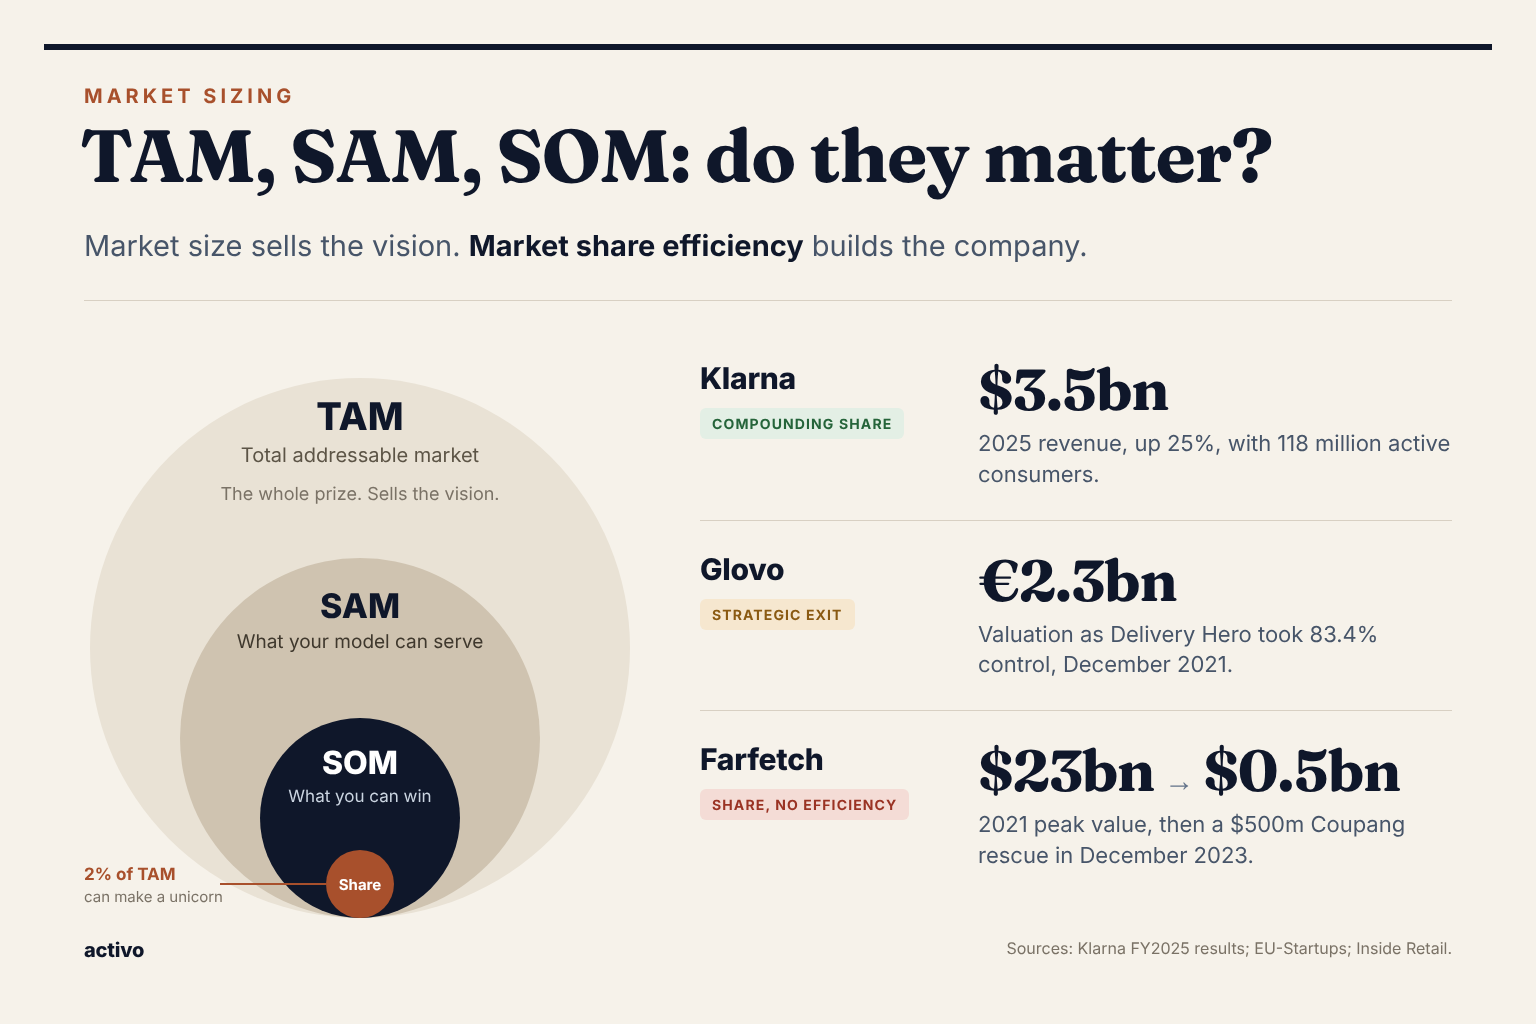
TAM, SAM and SOM give you a view of how big your opportunity could be. TAM (total addressable market) shows the maximum prize and helps you sell the vision. SAM (serviceable addressable market) filters it to the part your business model can reach. SOM (serviceable obtainable market) is what you can realistically win with the team, channels and capital you have.
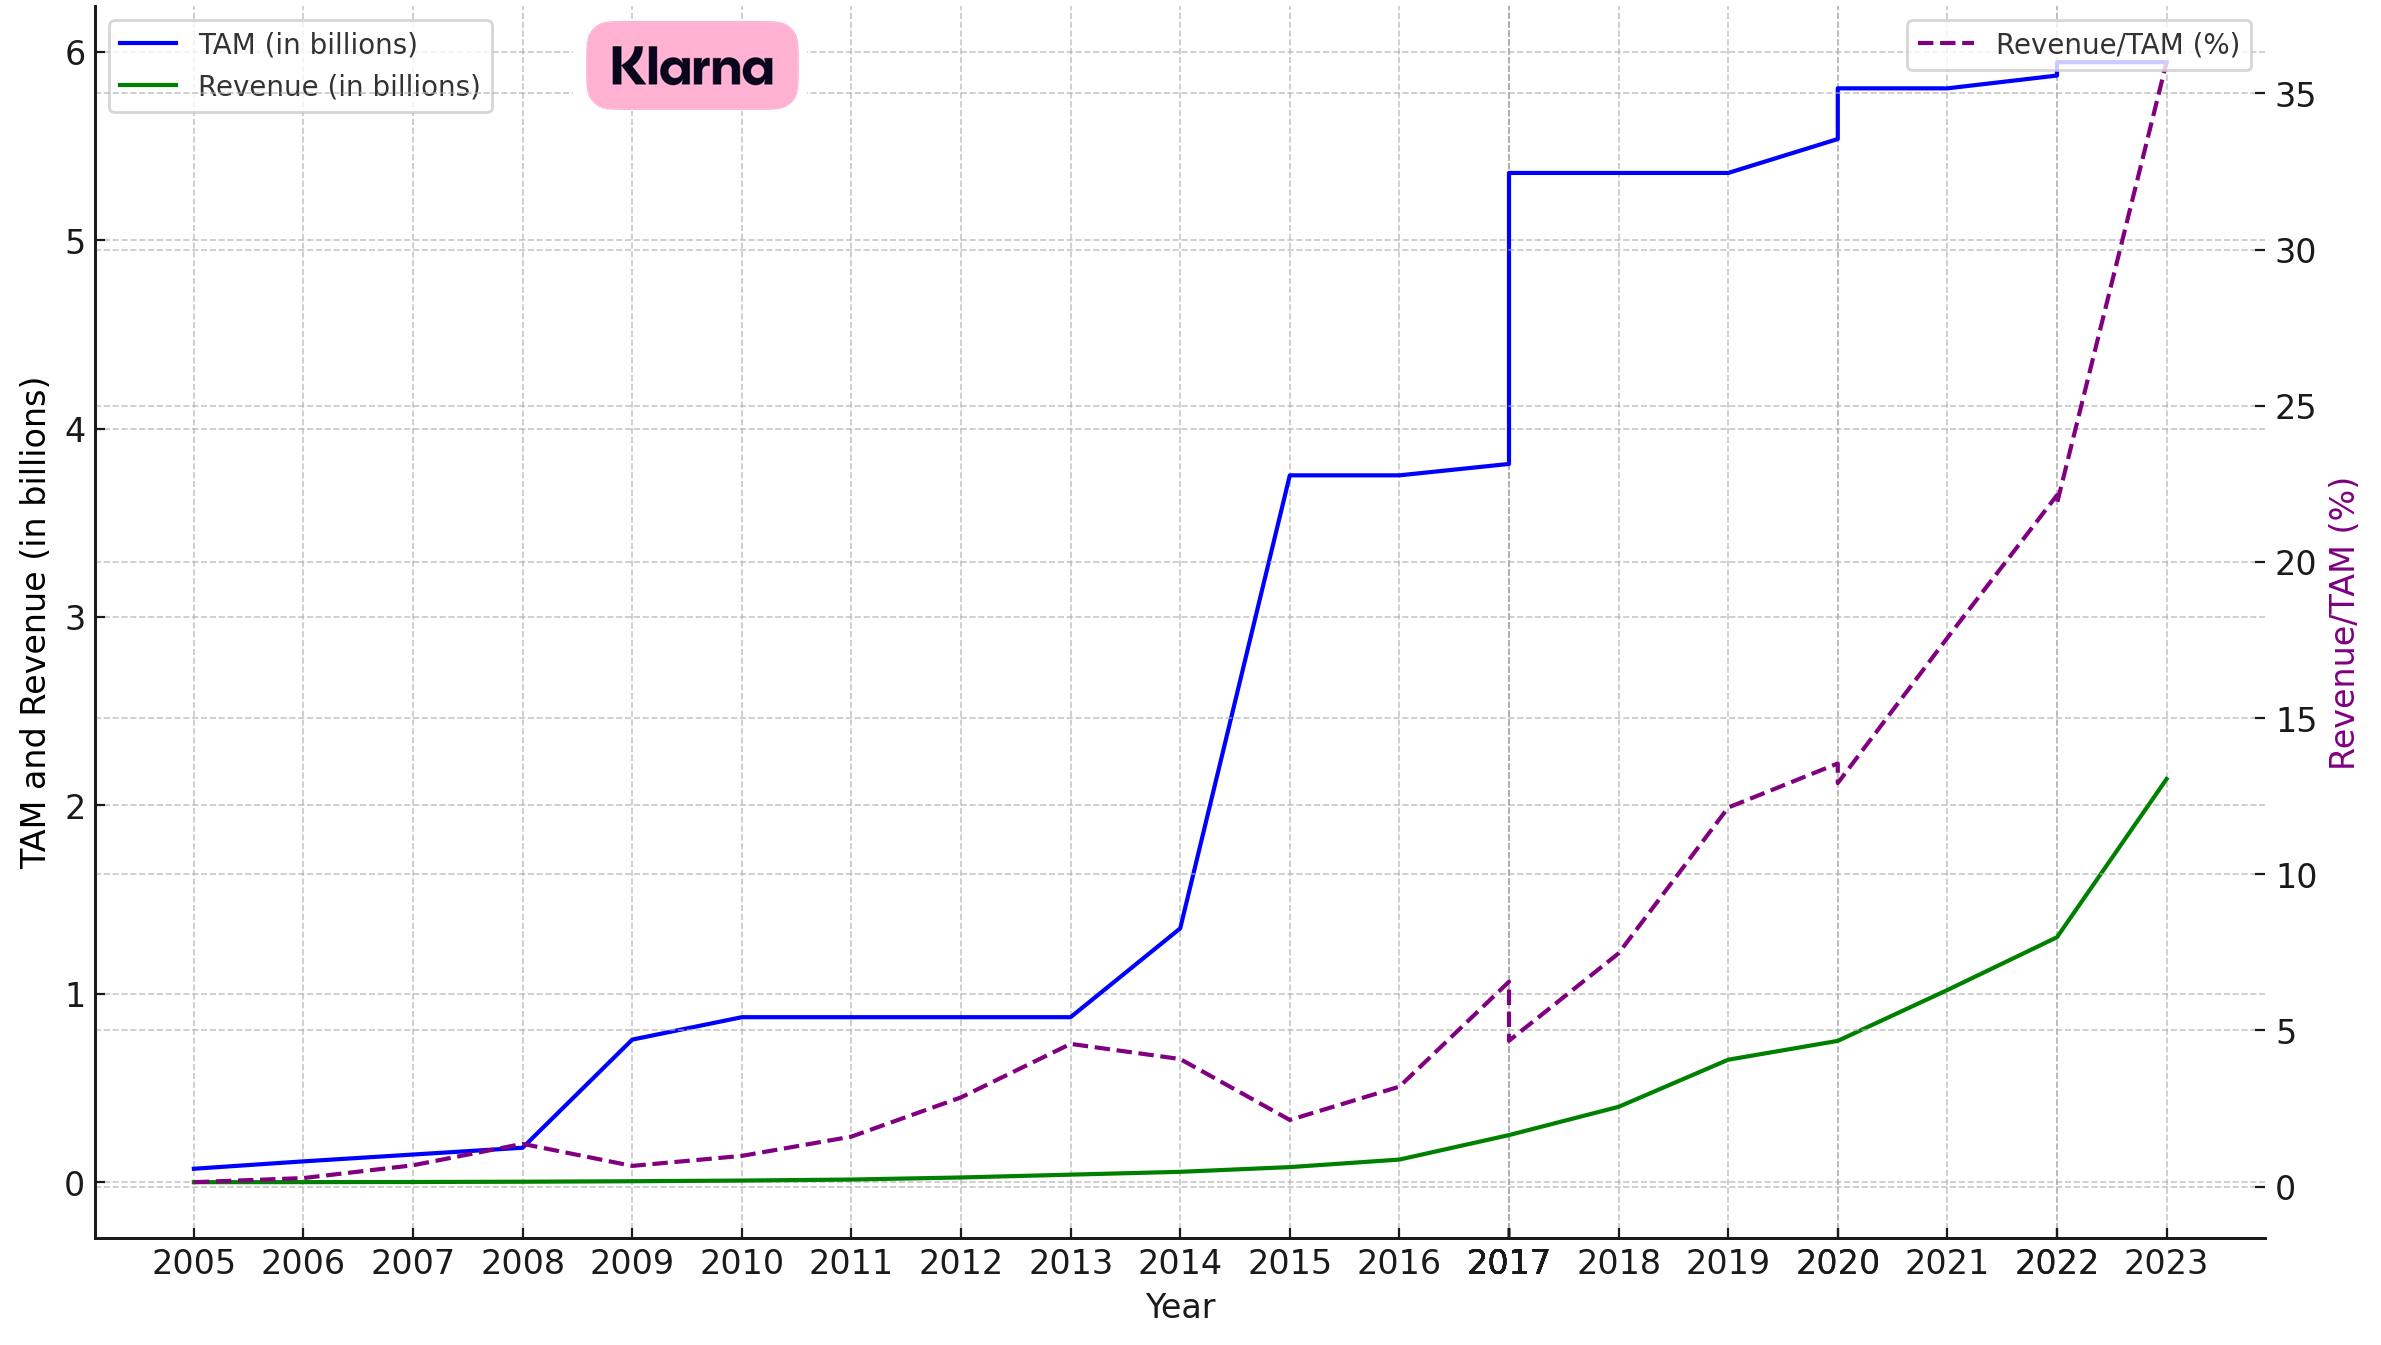
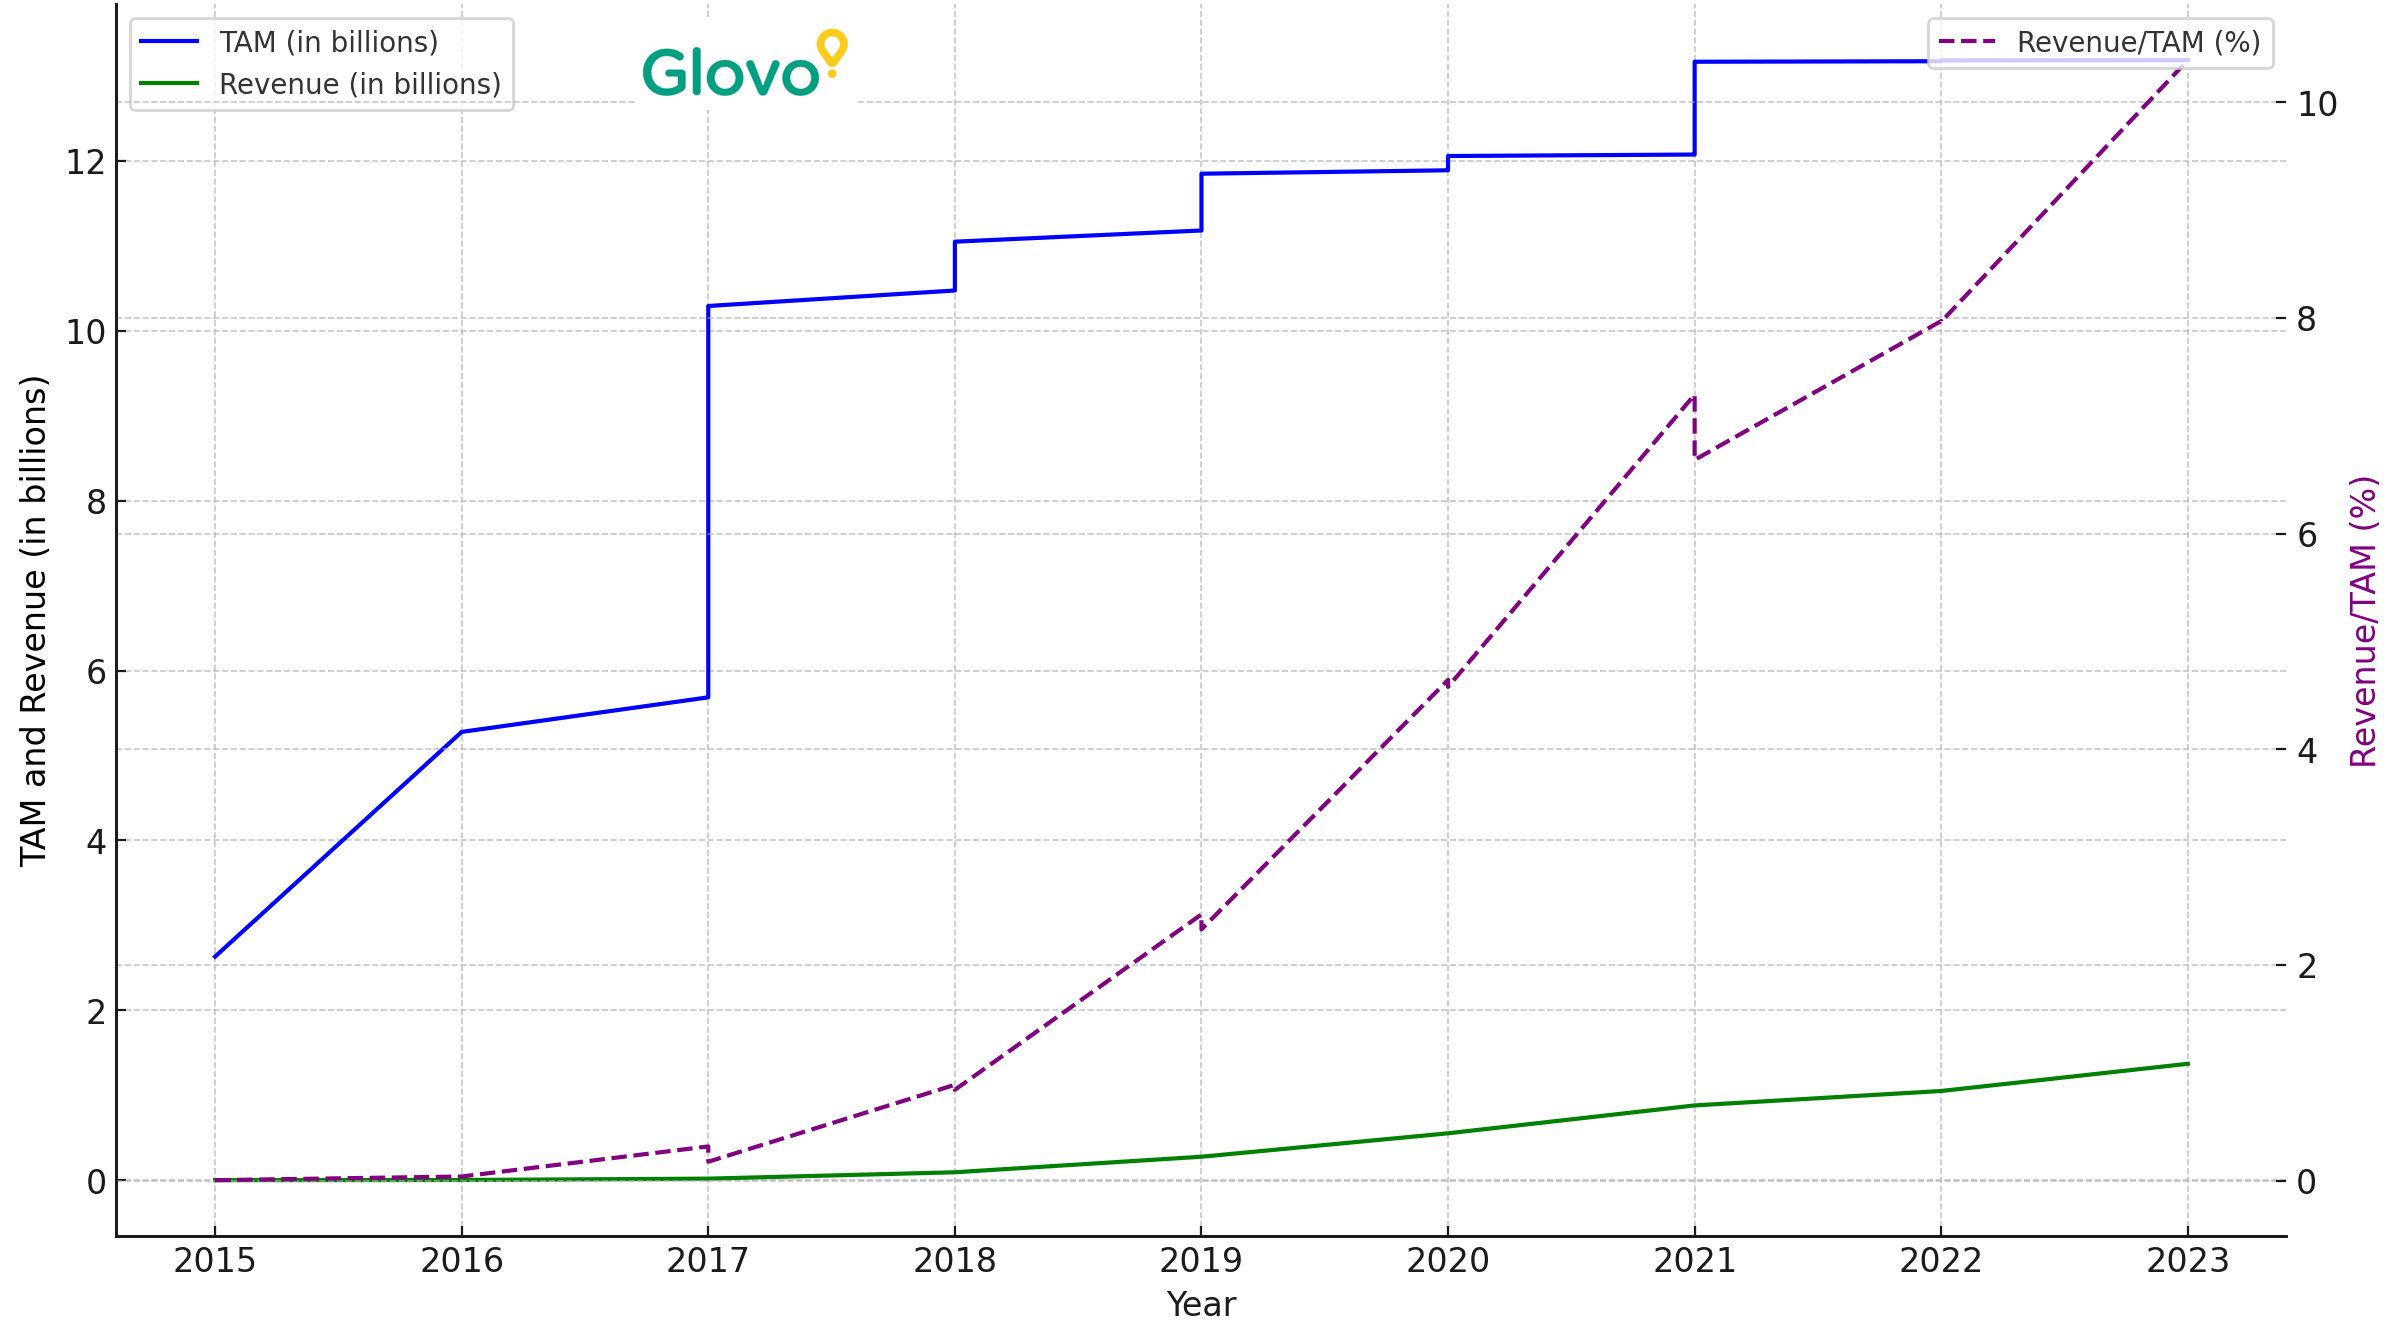
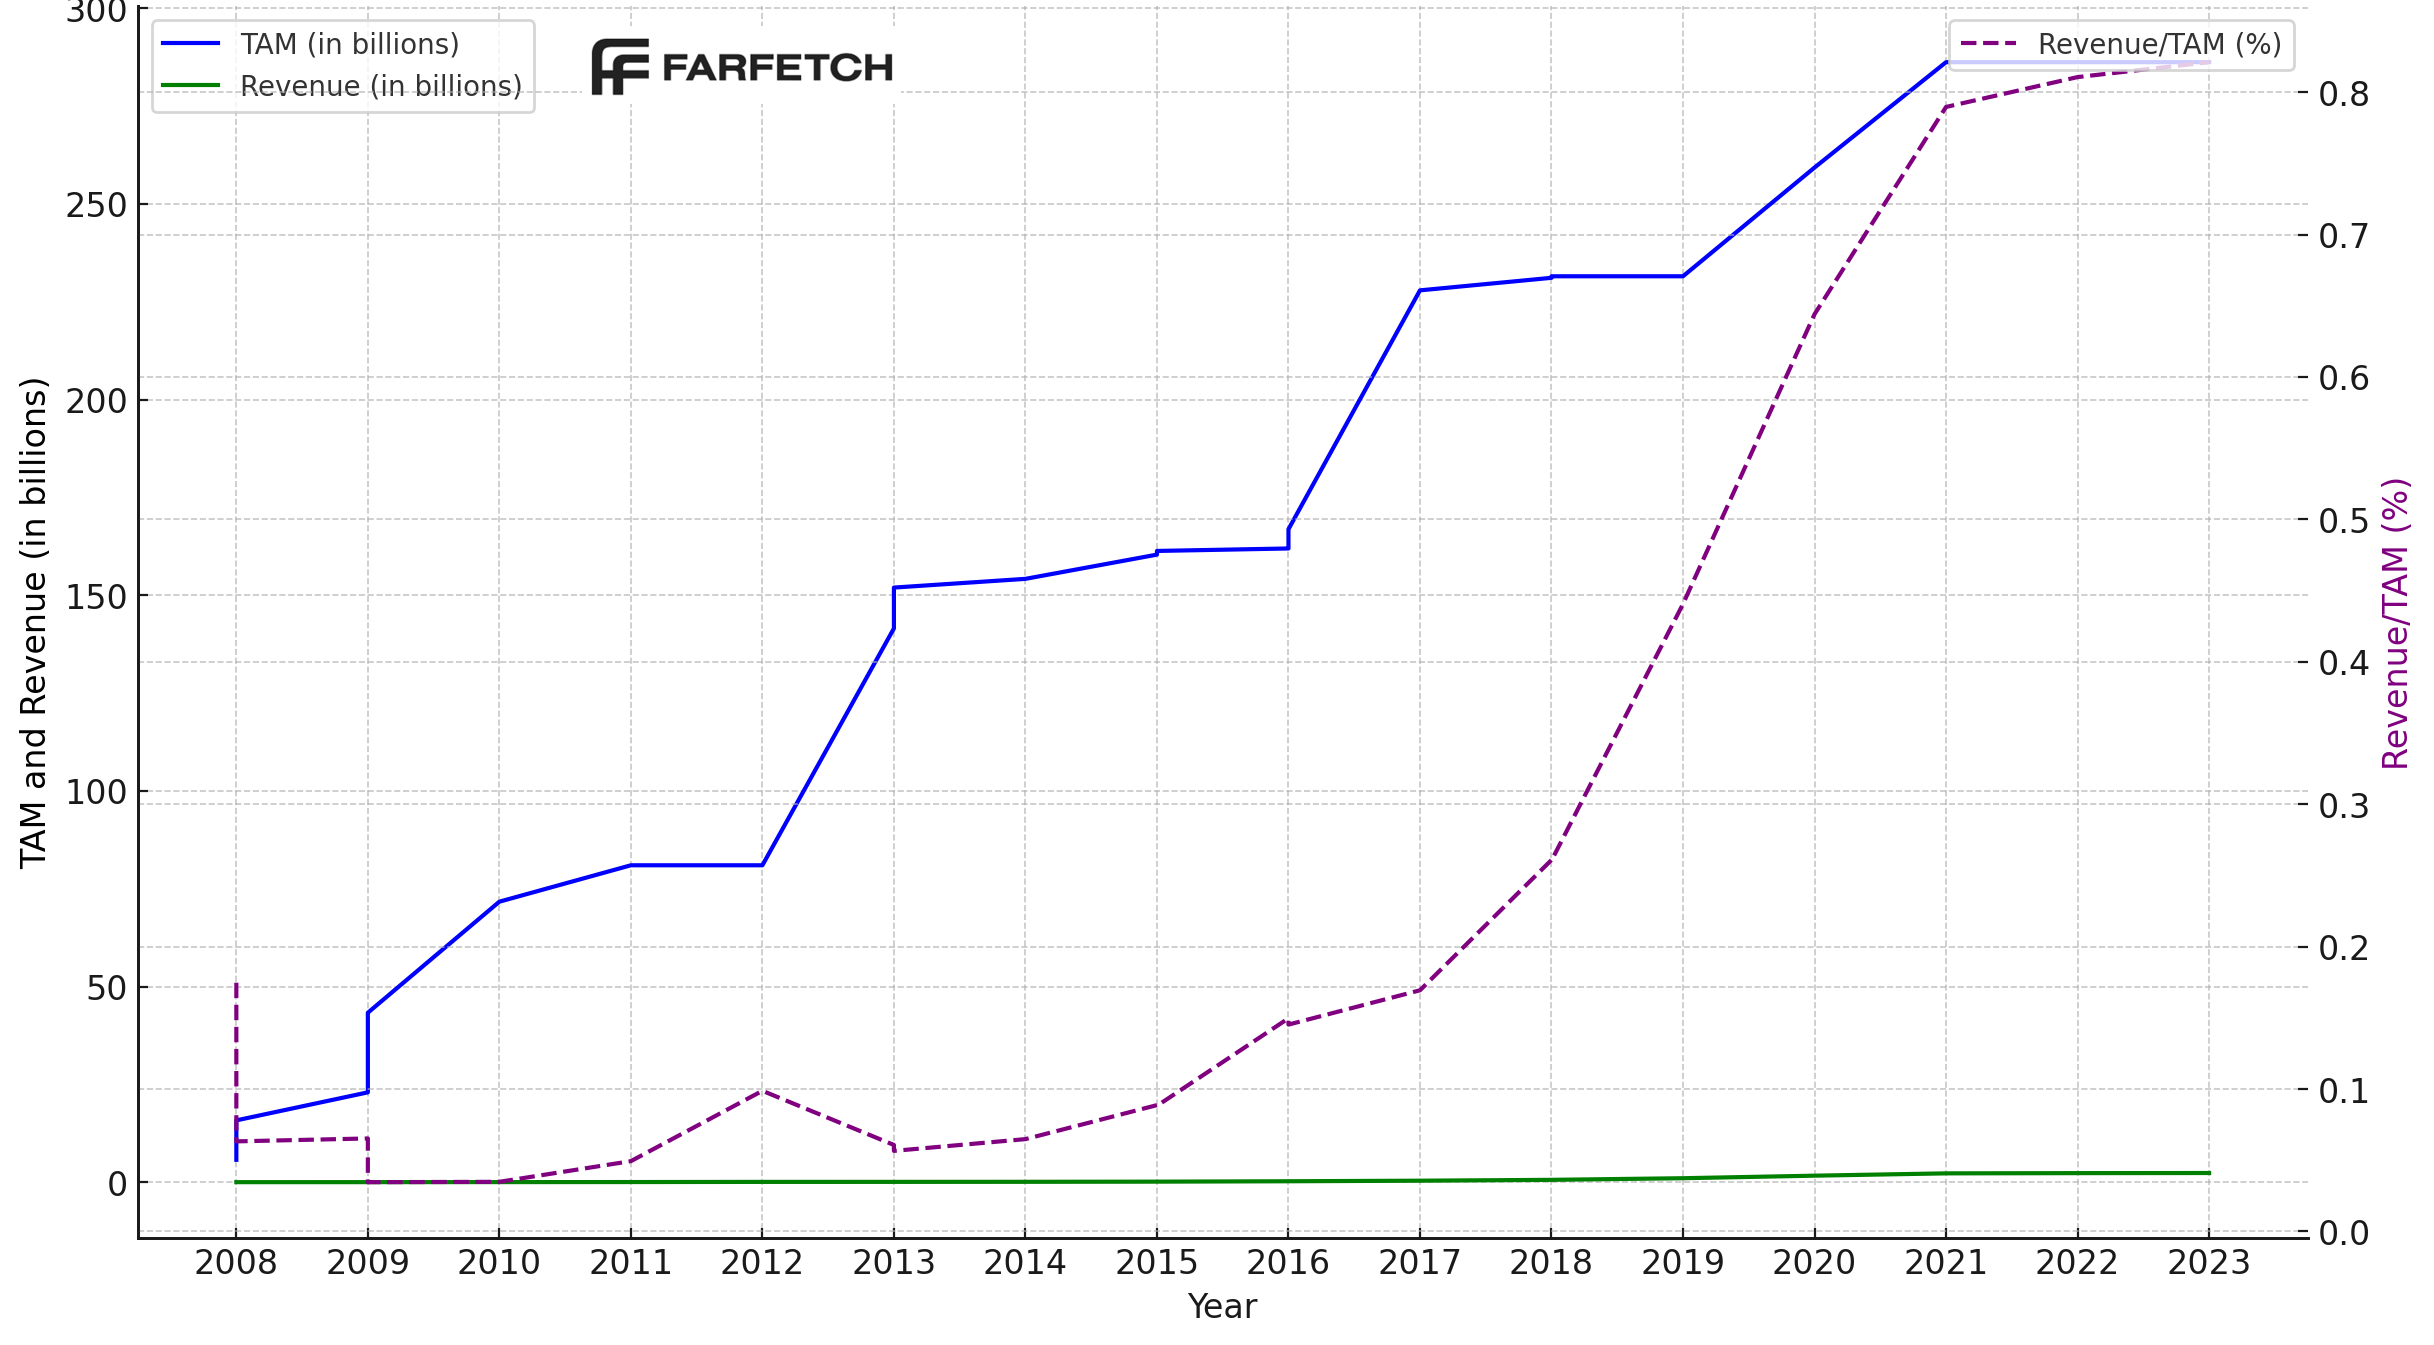
They matter, but not in the way most pitch decks use them. The number investors remember is not your TAM. It is whether your revenue is growing faster than your market, and how efficiently you are taking share. Take a look at Glovo, Klarna and Farfetch and their revenue against TAM. Updated October 2026 with AI-era market sizing and new investor data.
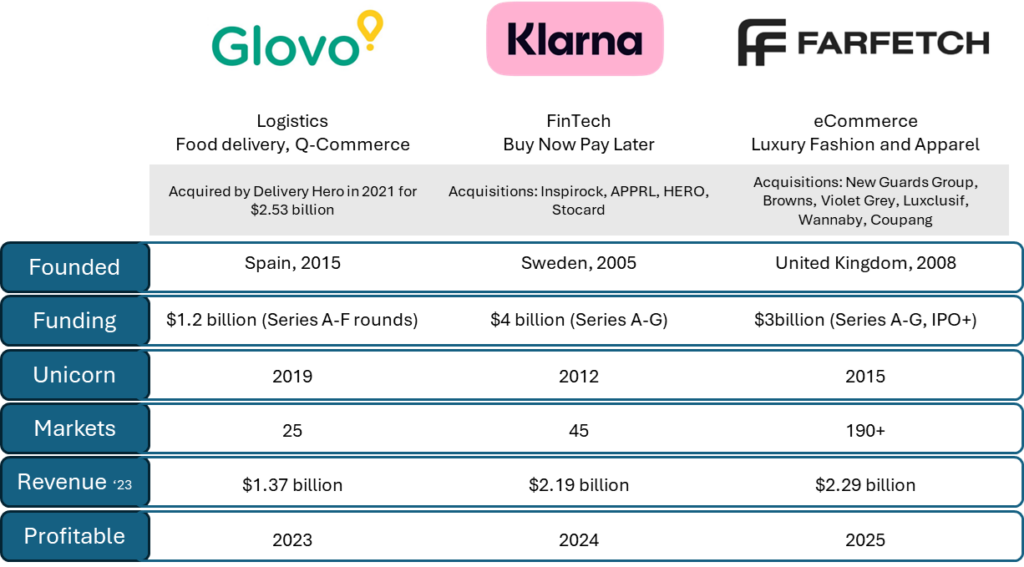
Build it bottom-up, not top-down
A top-down TAM quotes an analyst report (“a $50bn market”). A bottom-up TAM counts real buyers and multiplies by a price they would pay. Investors trust the second, because it shows you understand who buys and why.
TAM is not fixed: the Uber lesson
In 2014, valuation professor Aswath Damodaran valued Uber at about $5.9bn. He assumed a $100bn global taxi and car-service market and capped Uber’s share at 10%, implying roughly $10bn of potential revenue. Investor Bill Gurley replied that this assumed the future would look like the past. Cheaper, faster, more reliable rides would expand the market, not just take share. He put the realistic TAM at $450bn to $1.3 trillion.
The lesson is not “make your TAM bigger”. It is that your product strategy decides your TAM. Show investors how your product could expand the market, by region and over time, rather than quoting one static number.
AI is changing what counts as your market
For twenty years, software startups sized their market by counting software budgets: how many companies buy this kind of tool, multiplied by the price of a licence. AI agents change the maths. When your product does the work instead of helping someone do it, you are no longer competing for the software budget. You are competing for the budget that pays for the work itself: salaries and outsourced services.
That budget is far bigger. Foundation Capital puts it at about $4.6 trillion: $2.3 trillion in salaries for roles such as sales and marketing, software engineering, security and HR, plus $2.3 trillion spent on outsourced IT and business process services. For scale, Salesforce, the biggest business applications company, was earning about $35bn a year when that analysis was published.
This is the Uber lesson again. If your agent resolves customer support tickets, your TAM is not the number of help-desk seats in the world. It is what companies spend resolving those tickets today, mostly on people. Price per outcome, and the market you can serve grows with every task you take on.
| Lens | Software budget | Work budget |
|---|---|---|
| What you count | Firms that buy bookkeeping software | What firms pay people to do routine bookkeeping |
| Example maths | 2,000,000 firms × £1,200 licence = £2.4bn | 2,000,000 firms × £4,000 of bookkeeping help = £8bn |
| How you charge | Per seat or per company, per month | Per task, per transaction or a share of the saving |
| What investors need to see | Adoption and retention | Proof that customers move budget from people to your product |
The figures are illustrative, for the bookkeeping tool used above. The bigger number only counts if you can show customers actually switching spend. Investors will credit the work budget once you have a few customers who have cut their outsourced bill or redeployed staff, and not before.
What really matters: market share efficiency
In my view, revenue against TAM, or market share efficiency (MSE), is more interesting than the size of the market. A simple working definition: MSE = your market share ÷ your share of total category sales and marketing spend. If you hold 4% of the market with only 2% of the category’s spend, your MSE is 2: you are twice as efficient as the average competitor. MSE kicks in when you have an edge and can scale it across several markets, and it is what drives profitability and return on investment.
Three companies, three outcomes
| Company | What happened | The lesson |
|---|---|---|
| Klarna | Kept compounding share: 2025 revenue of $3.5bn (+25%), $127.9bn of GMV and 118 million active consumers. | Share gains that keep compounding across markets are what turn a big TAM into a big business. |
| Glovo | Delivery Hero took 83.4% control in a deal valuing Glovo at €2.3bn (December 2021). | Strong regional share made Glovo a strategic asset to a global consolidator. |
| Farfetch | Valued at more than $23bn at its 2021 peak. In December 2023, Coupang took over with a $500m lifeline. | Share without profitable efficiency is fragile. A large TAM did not save it. |
What investors look for on your market slide
Investors move quickly. DocSend’s research finds they now spend less than three minutes on a whole pitch deck, so your market slide gets seconds, not minutes. In that time they are answering five questions. Make each answer visible on the slide.
| The question they are asking | What convinces them |
|---|---|
| Is the prize big enough? | A bottom-up TAM with the maths on the slide, and how it grows by market and by year. |
| Can this team reach it? | A SAM tied to your real channel, region and business model, not the whole world. |
| Is the SOM believable? | A SOM built from sales capacity and conversion rates, checked against comparable companies. |
| Why now? | A shift that opens the market: new regulation, a cost that has collapsed, a change in buyer behaviour or, increasingly, AI doing work that used to need people. |
| Who else wants it? | The share held by today’s leaders and why your market share efficiency will beat theirs. |
Keep the slide simple: three numbers, one line of logic under each, and the source for every assumption in the appendix. If an investor wants to dig in, the detail is there. If not, the headline still holds.
Five market sizing mistakes to avoid
| Mistake | Why it hurts | Do this instead |
|---|---|---|
| Quoting one analyst number | Every competitor quotes the same report, so it says nothing about you. | Build bottom-up and use reports only as a sanity check. |
| “We only need 1% of the market” | It shows you have not worked out how you will win customers. | Build SOM from capacity: sales reps, conversion rates and onboarding time. |
| Mixing currencies, years and regions | Numbers that do not reconcile undermine trust in everything else. | One currency, one base year, and every assumption written down. |
| Counting buyers who cannot buy | It inflates SAM with segments your model cannot serve. | Filter by region, company size, channel and tech stack. |
| Ignoring how AI moves the market | You may undersize the opportunity, or miss a rival that prices per outcome. | Show the software budget and the work budget, and say which one you are going after. |
The challenge
It can take years to reach the point where your revenue grows faster than your TAM. If you do not get there, a competitor will. Modelling TAM, SAM and SOM far into the future is hard, but resisting the temptation to inflate your SOM is harder. Smart investors will respect a smaller SOM that is real, and a credible plan to improve your market share efficiency. Remember that less than 2% of TAM can still get you to unicorn status.
Your market sizing plan
- Count your buyers. List the exact customer type, how many exist in each market you will enter, and the price you can defend with two or three comparables. That is your bottom-up TAM.
- Filter to SAM. Remove buyers your model cannot serve today: wrong region, language, channel, size or tech stack.
- Set a SOM from capacity. Work out how many customers your sales and onboarding capacity can win each year for the next three years. Do not use a percentage of TAM.
- Draw a TAM roadmap. Show TAM by market and by year, including how your product could expand the market, as Uber did.
- Track MSE every quarter. Estimate your market share and your share of category spend, and set a milestone such as 2% of TAM. Then remove the barriers to winning share, relentlessly.
Do your TAM, SAM and SOM homework, but present it so it speaks to both the vision and the reality. Happy pitching!
Market size feeds straight into what your business is worth. The Business Valuation Report gives you a value range and its drivers from six numbers you already know. Explore Business Valuation Report →
We build bottom-up TAM, SAM and SOM models and market share efficiency plans for founders preparing to raise.
Get in touchSources: Bill Gurley, How to Miss by a Mile (2014); Uber full-year 2025 results; Klarna full-year 2025 results; EU-Startups on Delivery Hero and Glovo; Inside Retail on Farfetch and Coupang; The VC Factory; TechCrunch; Antler; Foundation Capital, AI leads a service-as-software paradigm shift (2024); Crunchbase, Q3 2026 global funding; ICONIQ, 2026 State of AI; DocSend pitch deck research.